Table of Contents
- Using Help
- Contacting ASSET InterTech
- Introduction to SourcePoint
- SourcePoint Environment
- SourcePoint Overview
- SourcePoint Parent Window Introduction
- SourcePoint Icon Toolbar
- File Menu
- File Menu - Project Menu Item
- File Menu - Layout Menu Item
- File Menu - Program Menu Item
- File Menu - Macro Menu Item
- File Menu - Print Menu Items
- File Menu - Update Emulator Flash Menu Item
- File Menu - Program Target Device Menu Item
- File Menu - Other Menu Items
- Edit Menu
- View Menu
- Processor Menu
- Options Menu
- Options Menu - Preferences Menu Item
- Options Menu - Target Configuration Menu Item
- Options Menu - Load Target Configuration File Menu Item
- Options Menu - Save Target Configuration File Menu Item
- Options Menu - Emulator Configuration Menu Item
- Options Menu - Emulator Connection Menu Item
- Options Menu - Emulator Reset Menu Item
- Options Menu - Confidence Tests Menu Item
- Window Menu
- Help Menu
- How To -- SourcePoint Environment
- Add Emulator Connections
- Configure Custom Macro Icons
- Configure Autoloading Macros
- Display Text on the Icon Toolbar
- Edit Icon Groups to Customize Your Toolbars
- Modify a Defined Memory Region
- Refresh SourcePoint Windows
- Save a Program
- Start SourcePoint With Command Line Arguments
- Use the New Project Wizard
- Verify Emulator Network Connections
- SourcePoint Overview
- Breakpoints Window
- Breakpoints Window Overview
- How To - Breakpoints
- Code Window
- Command Window
- Command Window Overview
- Confidence Tests Window
- Confidence Tests Window Overview
- Descriptors Tables Window
- Descriptors Tables Window Overview
- How To - Descriptors
- Devices Window
- Devices Window Overview
- How To - Devices Window
- Log Window
- Log Window Overview
- Memory Window
- Memory Window Overview
- How To - Memory Window
- Page Translation Window
- Page Translation Windows Overview
- PCI Devices Window
- PCI Devices Window Overview
- How To - PCI Devices Window
- Registers Window
- Registers Window Overview
- How To - Registers
- Symbols Windows
- Symbols Window Overview
- How To - Symbols Window
- Trace Window
- Trace Window Overview
- How To - Trace Window
- Advanced
- Viewpoint Window
- Viewpoint Window Overview
- Watch Window
- Watch Window Overview
- How To - Watch Window
- Technical Notes
- Descriptor Cache: Revealing Hidden Registers
- UEFI Framework Debugging
- Memory Casting
- Microsoft PE Format Support in SourcePoint
- Multi-Clustering
- Python/CScripts
- OpenIPC Integration, Installation and Usage
- Registers Keyword Table
- SourcePoint Licensing
- Stepping
- Symbols Textsym Format
- Target Configuration
- Using Bookmarks
- Which Processor Is Which
- Getting Started with DbC
- SourcePoint Command Language
- Overview
- Commands and Control Variables
- aadump
- abort
- abs
- acos
- advanced
- asin
- asm
- asmmode
- atan
- atan2
- autoconfigure
- base
- bell (beep)
- bits
- break
- breakall
- cachememory
- cause
- Character Functions
- clock
- continue
- cos
- cpubreak commands
- cpuid_eax
- cpuid_ebx
- cpuid_ecx
- cpuid_edx
- createprocess
- cscfg, local_cscfg
- csr
- ctime
- cwd
- dbgbreak commands
- defaultpath
- #define
- define
- definemacro
- deviceconfigure
- devicelist
- devicescan
- disconnect
- displayflag
- do while
- dos
- dport
- drscan
- edit
- editor
- emubreak, emuremove, emudisable, emuenable
- emulatorstate
- encrypt
- error
- eval
- evalprogramsymbol
- execution point ($)
- exit
- exp
- fc
- fclose
- feof
- fgetc
- fgets
- first_jtag_device
- flist
- flush
- fopen
- for
- forward
- fprintf
- fputc
- fputs
- fread
- fseek
- ftell
- fwrite
- getc
- getchar
- getnearestprogramsymbol
- getprogramsymboladdress
- gets
- globalsourcepath
- go
- halt
- help
- homepath
- idcode
- if
- include
- invd
- irscan
- isdebugsymbol
- isem64t
- isprogramsymbol
- isrunning
- issleeping
- issmm
- itpcompatible
- jtagchain
- jtagconfigure
- jtagdeviceadd
- jtagdeviceclear
- jtagdevices
- jtagscan
- jtagtest
- keys
- last
- last_jtag_device
- left
- libcall
- license
- linear
- list, nolist
- load
- loadbreakpoints
- loadlayout
- loadproject
- loadtarget
- loadwatches
- log, nolog
- log10
- loge
- logmessage
- macropath
- Memory Access
- messagebox
- mid
- msgclose
- msgdata
- msgdelete
- msgdr
- msgdump
- msgir
- msgopen
- msgreturndatasize
- msgscan
- msr
- num_activeprocessors
- num_all_devices
- num_devices
- num_jtag_chains
- num_jtag_devices
- num_processors
- num_uncore_devices
- openipc
- pause
- physical
- port
- pow
- print cycles
- printf
- proc
- processorcontrol
- processorfamily
- processormode
- processors
- processortype
- projectpath
- putchar
- puts
- rand
- readsetting
- reconnect
- Register Access
- reload
- reloadproject
- remove
- reset
- restart
- return
- right
- runcontroltype
- safemode
- save
- savebreakpoints
- savelayout
- savewatches
- selectdirectory
- selectfile
- shell
- show
- sin
- sizeof
- sleep
- softbreak, softremove, softdisable, softenable
- sprintf
- sqrt
- srand
- step
- stop
- strcat
- strchr
- strcmp
- strcpy
- _strdate
- string [ ] (index into string)
- strlen
- _strlwr
- strncat
- strncmp
- strncpy
- strpos
- strstr
- _strtime
- strtod
- strtol
- strtoul
- _strupr
- swbreak
- switch
- swremove
- tabs
- tan
- tapdatashift
- tapstateset
- targpower
- targstatus
- taskattach
- taskbreak, taskremove, taskdisable, taskenable
- taskend
- taskgetpid
- taskstart
- tck
- time
- uncoreconfigure
- uncorescan
- #undef
- unload
- unloadproject
- upload
- use
- verify
- verifydeviceconfiguration
- verifyjtagconfiguration
- version
- viewpoint
- vpalias
- wait
- wbinvd
- while
- windowrefresh
- wport
- writesetting
- yield
- yieldflag
Trace Window Introduction
The Trace window displays a history of executed instructions and/or events. The following types of trace are supported:
LBR Trace
LBR trace displays a history of executed instructions. It does this by reading Branch Trace Messages (BTMs) from the Last Branch Record MSRs in the processors.
The advantage of LBR trace is it is non intrusive. The processor can run at full speed when using LBR trace. The disadvantage of LBR trace is the limited number of LBRs available (typically 4 - 16). Each LBR stores a single BTM. If you assume an average of 5 instructions between branches, then roughly the last 80 instructions executed are traced.
BTS Trace
BTS trace displays a history of executed instructions. It does this by reading Branch Trace Messages (BTMs) from the Branch Trace Store (BTS), an area of system memory set aside for trace.
The BTS can be much larger, and store many more BTMs than LBRs. The disadvantage of using the BTS is that writing BTMs to memory takes longer than writing BTMs to LBRs. Each branch results in 12-24 bytes of memory being written. For some applications BTS trace may result in too high a speed penalty to use. Another disadvantage of BTS trace is the inability to trace out of reset (if memory is unavailable).
BTS trace and LBR trace are not mutually exclusive. They can both be enabled at the same time.
BTS trace can also provide timestamp data to determine how long a section of code took to execute. This timestamp capability requires the same patch mechanism as Event trace (see below).
See BTS Trace Configuration for a more detailed description of BTS trace.
AET Trace
Architectural Event trace (AET) captures information about certain types of events (e.g., I/O accesses, MSR reads and writes, interrupts, exceptions, BTMs, etc.). AET trace requires either an emulator with trace hardware (e.g., LX-1000) or a target with trace hub capability.
AET trace also provides timestamp data to determine how long a section of code took to execute.
See AET Trace Configuration for a more detailed description of AET trace.
Intel Processor Trace (Intel PT)
Intel PT is similar to BTS trace in that a region of system memory is set aside to record trace data. The advantage of Intel PT trace over BTS trace is there is very little slowdown of the processor. As with BTS trace, tracing out of reset (before system memory is initialized) is not supported.
Note: Early versions of Intel PT trace were referred to as RTIT (Real Time Instruction Trace).
Note: On some processors, LBR trace and Intel PT are mutually exclusive. SourcePoint will display an error message if both trace types are enabled.
See Intel_PT Configuration for a more detailed description of Intel PT trace.
System Trace
System trace refers to software / firmware trace routed through the Trace Hub. The Trace Hub is a new Intel trace architecture available on some targets. If this form of trace is available, then a Trace Hub tab will be displayed in the Trace view’s Trace Configuration dialog.
System trace is typically software-generated ASCII messages, but can also include other forms of trace data. See Trace Hub Configuration for a more detailed description of system trace.
The Trace Window
To open the Trace window, select View|Trace on the menu bar or click on the Trace icon on the toolbar.
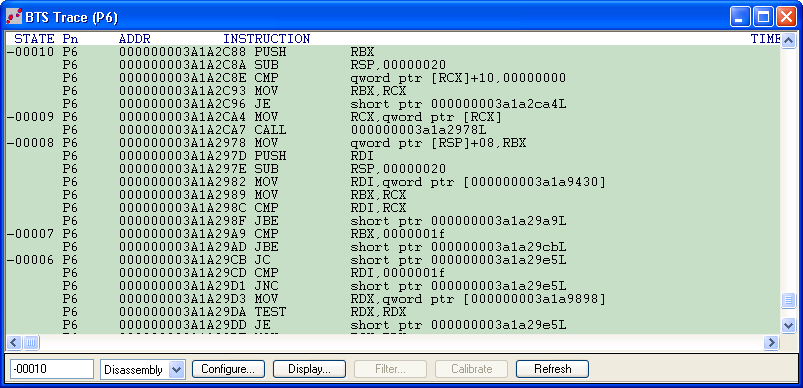
Trace window (Disassembly mode)
More than one trace window can be opened. A common use case is to have one Trace window display BTS trace and another Trace window display Event trace, and to enable automatic time alignment between windows. Scrolling in one Trace window will automatically scroll the other Trace window so that the same area of trace (based on timestamp) is displayed.
There are three display modes: State, Mixed, and Disassembly. The normal display mode is Disassembly. State and Mixed are used primarily for troubleshooting trace capture problems.
Disassembly Mode. This mode shows disassembled instructions. This is the default display mode. Source code information can also be displayed. See the section on the Trace Display Settings dialog box for a list of information that can be displayed. The following fields are displayed in Disassembly mode:
-
State. Displays the state number (cycle number) of the instruction. The trigger location is marked as 0. Cycles before the trigger are negative numbers, while cycles after the trigger are positive numbers.
-
Pn. Displays the trace source (the processor that generated the trace).
-
Addr. Displays the address of the instruction.
-
Opcode. Displays the instruction opcode bytes. Up to 10 bytes are shown. If the instruction is longer than 10 bytes, then the tooltip can be used to display all of the instruction bytes.
-
Instruction. Displays the disassembled instruction (mnemonic and operands).
-
TimeStamp (all but LBR). Displays timestamp information. This can include accumulated time (time from a given point in trace), or delta time (time between trace cycles).
State Mode. State mode shows raw trace data. This mode is used primarily for troubleshooting hardware or disassembly problems. The following fields are displayed:
-
State. Displays the state number (cycle number) of the instruction. The trigger location is marked as 0. Cycles before the trigger are negative numbers, while cycles after the trigger are positive numbers.
-
Pn. Displays the trace source (the processor that generated the trace).
-
From BTM source address
-
TimeStamp (all but LBR). Displays timestamp information. This can include accumulated time (time from a given point in trace), or delta time (time between trace cycles). Note: BTS trace has two formats: 32-bit (12 byte BTMs) and 64-bit (24 byte BTMs). Timestamp is only supported with the 64-bit format.
-
STS (Event trace only). Displays the type of event
-
LIP (Event trace only). Displays the last instruction pointer value. This is usually the instruction that caused the event.
-
TSC (all but LBR). Display the raw timestamp counter value. This is the value that timestamps are calculated from.
-
AUX1 (Event trace only). Displays auxiliary data packet #1. Format varies based on event type.
-
AUX2 (Event trace only). Displays auxiliary data packet #2. Format varies based on event type.
Mixed Mode. Displays both state and disassembly data.
Trace Window Dialog Bar
The dialog bar at the bottom of the Trace window contains shortcuts to often-used features. Display of the dialog bar is optional. It can be turned off via the View menu. All functionality in the dialog bar is also available in the Trace window menu.
Cycle Number
The current cycle number (the location of the caret in the Trace window) is shown at the far left of the dialog bar. The trigger location is always marked as cycle 0. Cycles before the trigger are negative numbers, while cycles after the trigger are positive numbers. Enter a number in this field to jump to a particular location in trace.
Display Mode
This drop-down list lets you choose the display mode. There are three modes: Disassembly, State, and Mixed. For more information, see above.
Configure Button
The Configure button opens the Trace Configuration dialog box. This dialog is used to configure trace capture settings.
Display Button
The Display button opens the Trace Display Settings dialog box. This dialog is used to configure the display format of the Trace window.
Filter Button (Event trace only)
The Filter button opens the Trace Display Filtering dialog. This dialog is used to select which processor’s trace is displayed in the Trace view. This is post capture filtering. The Trace Configuration dialog can be used to select which processors to trace.
Calibrate Button
The Calibrate button calibrates the emulator's trace capture hardware. When used with AET trace, this calibrates the LX-1000 trace hardware. When used with SW/FW trace, this forces detection of the presence of the Trace Hub hardware.
Refresh Button
The Refresh button causes SourcePoint to re-read memory and trace data, and to re-disassemble trace. It also exits safe mode (DRAM accesses restricted by memory map) if currently enabled. This button is useful if memory was previously unavailable because of safe mode being enabled.
Trace Window Menu
The Trace menu displays on the menu bar after you have opened a Trace window. It is also displayed when right-clicking in the Trace window.
Trace Source Selection. The first few entries in this menu display the available trace sources (e.g., LBR, BTS, etc). Only trace sources that are enabled in the Trace Configuration dialog are displayed. When you enable a trace source, the Trace view automatically switches to that source.
State, Disassembly, Mixed. Selects the current display mode. Provides the same functionality as the Display Mode drop down list in the dialog bar.
Open Tracking Code Window. Opens a tracking Code window showing the instruction at the current caret position. Scrolling through trace causes the tracking window to scroll automatically, so the correct source is always displayed. This is an alternate method for displaying source code. The other method is to display source directly in the Trace window.
Open Memory Window. Opens a Memory window at the address indicated by the current caret position.
Open Trace Search Window. Opens the Trace Search window. This view provides a fast method for searching for code and data accesses, and also provides high level methods of viewing trace as function calls.
Note: Even though multiple Trace Windows can be opened, there is only one Trace Search window. The Trace Search window is associated with the Trace window it was opened from. If the associated Trace window is displaying IPT trace, then the IPT trace will be searched. If the Trace window is displaying emulator trace, then emulator trace will be searched. You can associate the Trace Search window with a different Trace window by selecting Open Trace Search Window in another Trace window.
Open Trace Statistics Window. Opens the Trace Statistics window. This view provides code and data profiling.
Note: Even though multiple Trace Windows can be opened, there is only one Trace Statistics window. The Trace Statistics window is associated with the Trace window it was opened from. If the associated Trace window is displaying IPT trace, then the IPT trace will be analyzed. If the Trace window is displaying emulator trace, then emulator trace will be analyzed. You can associate the Trace Statistics window with a different Trace window by selecting Open Trace Statistics Window in another Trace window.
Set Breakpoint. Sets a code breakpoint at the address indicated by the caret. The default breakpoint type is specified in the Preferences dialog box (Options | Preferences | Breakpoints). The choices are Hardware Breakpoint and Software Breakpoint.
Add/Edit Breakpoint. Opens the Breakpoint window for setting more complex breakpoints.
Go To Cycle. Directly positions the caret at a cycle in trace. This can also be accomplished by entering a new cycle number in the dialog bar.
Zero Timestamp (all but LBR). Zeros accumulated timestamp at the cycle indicated by the caret.
Viewpoint (all but LBR). Selects which processor’s trace is to be displayed. If Track Viewpoint is selected, the trace displayed is automatically changed whenever the processor viewpoint is changed.
Configure. Opens the Trace Configuration dialog box. Provides the same functionality as the Configure button in the dialog bar.
Display. Opens the Trace Display Settings dialog box. Provides the same functionality as the Display button in the dialog bar.
Filter. Opens the Trace Display Filtering dialog. Provides the same functionality as the Filter button in the dialog bar.
Calibrate. Calibrates the trace capture hardware. Provides the same functionality as the Calibrate button in the dialog bar. When used with AET trace, this calibrates the LX-1000 trace hardware. When used with SW/FW trace, this forces detection of the presence of the Trace Hub hardware.
Disassembly Uses. Indicates whether trace disassembly uses target memory or a cached program. The default is Cached Program, which is much faster. Target memory is used if no program has been loaded or if the program does not contain the required memory for an instruction.
Load Trace File. Displays disassembly of a binary trace file rather than emulator trace. In order to display disassembly, you must be either connected to the target where the original trace was captured, or the Trace window must be set to use Cached Program, and a program must be loaded.
Save Trace File. Saves all or a portion of the emulator trace as a binary trace file. During the save operation, a progress dialog box with a cancel button is displayed
Close Trace File. This command switches from displaying a binary trace file back to displaying normal trace (from the LX-1000).
Hide Field/Restore Fields. These settings apply to State display mode only. Individual fields can be hidden by positioning the caret in the field to be hidden and selecting the Hide Field menu item from the Trace menu. To re-enable the display of all fields, select Restore Fields. Note: When a new trace source is selected (LBR, BTS or Event), all fields are automatically re-enabled.
Refresh. Refresh trace disassembly. Provides the same functionality as the Refresh button in the dialog bar.
Copy Menu Item. Copies the selected text to the clipboard (CTRL+C).