About SourcePoint
SourcePoint is a platform of debug and trace tools for C/C++ embedded software and firmware for either Intel, AMD and Arm systems.
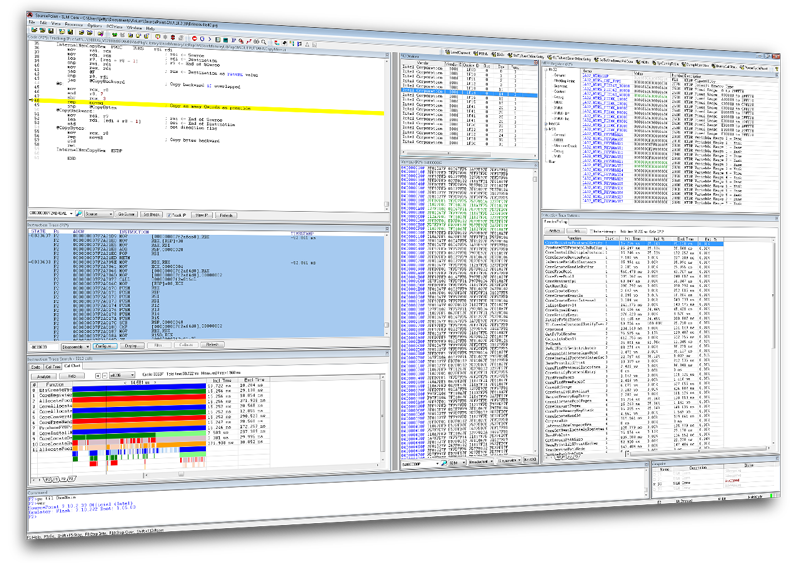
This robust environment features multiple views into code execution so that bugs are found fast and problems resolved quickly.
SourcePoint WinDbg - NEW!
SourcePoint, the best-in-class UEFI debugger, has been enhanced with OS-awareness of Windows through integration with Microsoft’s WinDbg debugger. As such, it can now exploit the power of our VMM and SMM breakpoints, Intel PT, AET, VMCS Viewer/Editor, and other powerful features to mitigate attacks on Windows security features.
SourcePoint WinDbg is also available in a lower-cost Home version for individual researchers and hobbyists.
SourcePoint for Intel
Powerful debugger for complex multiprocessor software on the latest Intel® processors. By working with Intel® Processor Trace and Trace Hub, SourcePoint slashes debug time.
SourcePoint for AMD
With new support for AMD’s server product CPUs, SourcePoint brings powerful run-control and UEFI source-level debug capabilities to the latest EPYC processors.
SourcePoint for Intel Trace
SourcePoint Trace captures all the details of code execution, with data, enabling pin-point root-cause detection; reducing debug time by as much as 50%.
SourcePoint WinDbg
The most powerful Windows debugger on the market. Exploit the power of JTAG to mitigate attacks on VBS Enclaves, HLAT, System Guard/DRTM, etc.
SourcePoint CScripts
Platform bring up is challenging and time-consuming. SourcePoint supports Intel CScripts to enable rapid insight for UEFI code debug and hardware problems, shortening platform power-on cycles.
SourcePoint for Arm
Multi-view debug and trace tools for multi-core, multi-threaded Arm SoC software. In tandem with CoreSight’s trace macrocells, SourcePoint quickly identifies root causes of bugs.
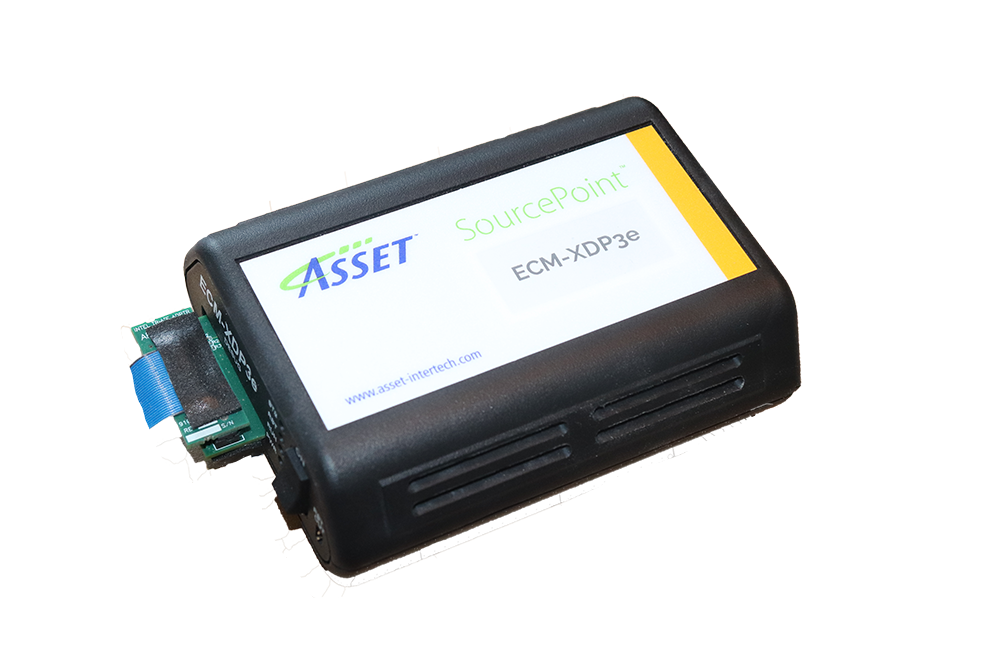
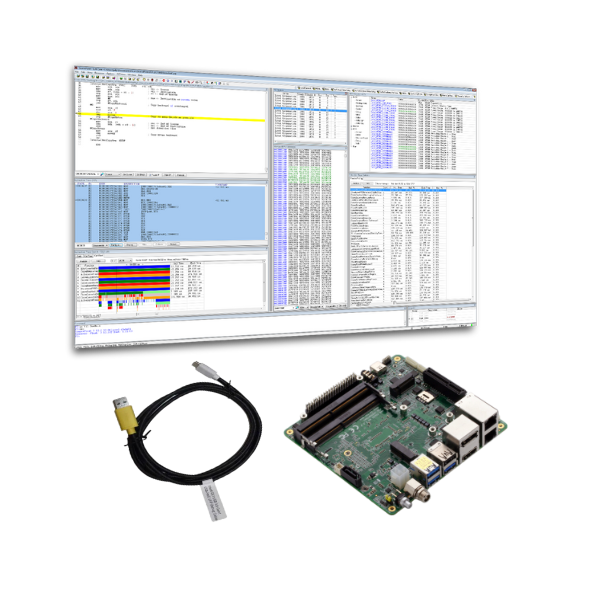
Hardware for SourcePoint
Arium hardware probes and trace port analyzer products are designed to make the developer’s job easier, and we take great care in developing hardware and software that is easy for the user to set up and configure to speed their development time.