SourcePoint Intel Trace
Home / Products / SourcePoint / SourcePoint Intel Trace
End the frustration! Tracing code execution is the only way to determine software bug root cause quickly. Code execution, both synchronous and asynchronous events, is how the software really operates. Software stacks have grown in complexity so much that even the silicon vendors are putting trace logic into the silicon, even Intel! It is a combination of silicon complexity, multi-core and heterogeneous cores, and the software runtime execution, on the hardware, that results in the most time consuming bugs.
SourcePoint Intel Trace provides clarity into these runtime asynchronous code event that are the toughest bugs to analyze because it captures all the events, code execution, regardless of source, leading up to the bug.
SourcePoint cuts code debug time by as much as 50% and helps accelerate your product’s time to market.

Intel System Level Views
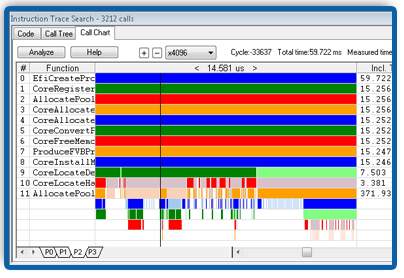
SourcePoint Trace with Call Charts provides a wealth of information in a single snapshot to provide rapid insight to locate the most difficult of software bugs. You need sophisticated tools to deal with complex problems. Tools that provide insight quickly. First-to-market, time-to-market or whatever your organization calls it, the pressure to deliver the software on time is growing at the same rate as the software complexity. SourcePoint Trace can provide that instrument to achieve your goal and prevent sleepless nights.
The SourcePoint Call Chart provides a visualization of code execution. The black marker shows a moment in time with all the function hierarchy listed. Providing the ability to visualize potential anomalies and overall execution patterns that could also indicate a problem.
Mining Intel Trace Data
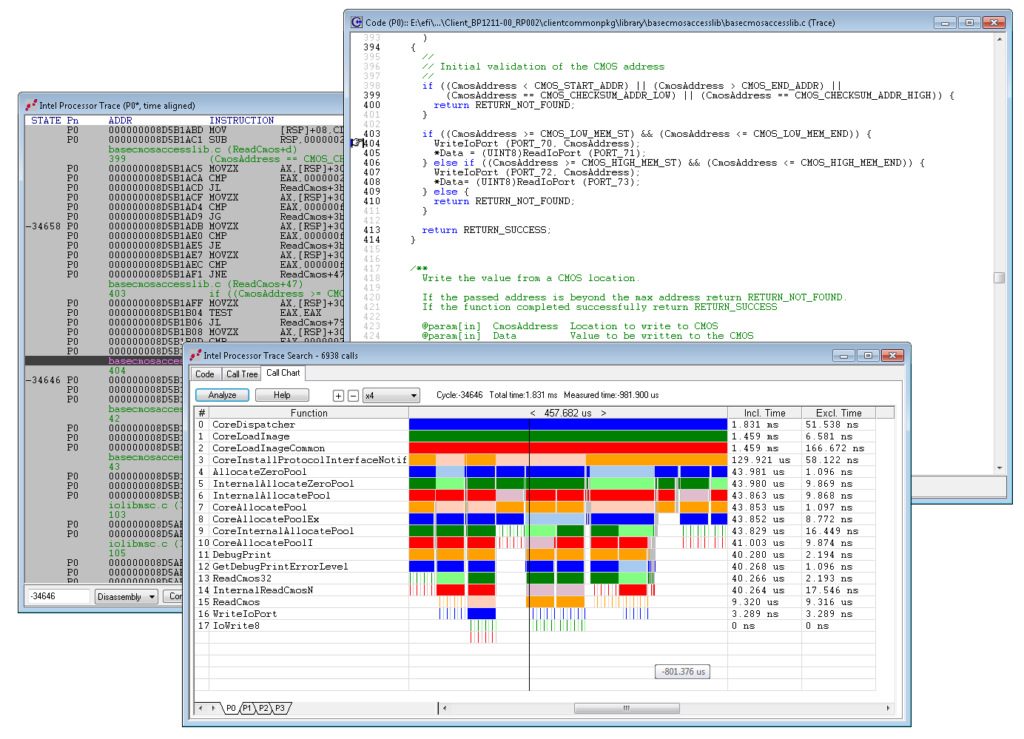
Once a problem has been located at the system level, drilling down to examine a possible cause requires a range of clear and insightful views. First, you’ll want to look at code execution from the highest system level, followed by the corresponding single source code line, and eventually down to the actual execution trace level.
Plus, all views are correlated and time-stamped, making SourcePoint a truly incredible tool for UEFI debug and performance analysis. SourcePoint empowers the developer to take advantage of silicon rich trace features like Trace Hub and Intel Processor Trace.
Organizations such as Broadcom, Cisco, Dell, DoD, EMC, Fujitsu, HP, IBM, Intel, ITT, Lenovo, LSI, Marvell, Samsung, Seagate, ST Micro, Western Digital, and many others benefit from using SourcePoint tools.
Intel Trace Hub
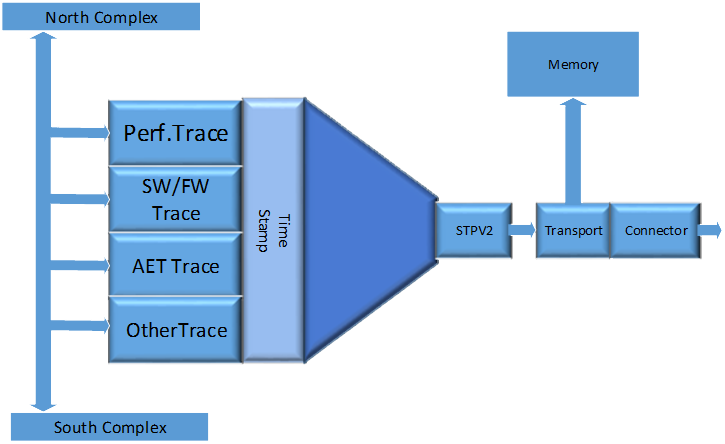
Trace Hub, according to Intel®, is hardware whose primary purpose is to enable customers to debug Intel Architecture (IA) base systems. The Intel Trace Hub collects and exports trace data from various hardware and software sources and delivers the data via system memory, USB, or MIPI PTI.
SourcePoint with Trace Hub
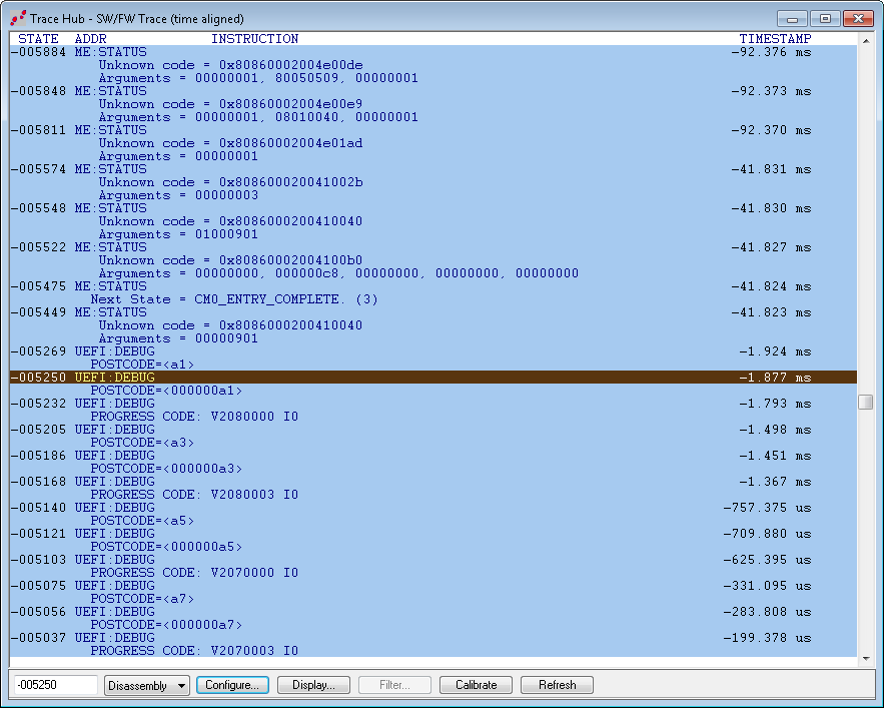
Trace Hub provides a crystal ball view into the code execution on the IA silicon and SourcePoint® provides clear views into that execution. Best of all you can configure the views and present the trace data in a form that best suits your needs. SourcePoint does the work of the silicon configuration and extracting data from these various sources. Then collecting the data and presenting it in a cohesive manner to show code flow thru the system fabric.
Showing the exact code behavior is tremendously insightful for the code developer. Imagine tracing code flow without disrupting execution speed and seeing either a narrow field of view covering milliseconds of execution or a broader view covering potentially seconds of code execution. The power of SourcePoint manifested.
Related Products
Intel® JTAG debugger products are designed to make the developer’s job easier. We have worked with Intel for over fifteen years, providing tools that are feature-rich in both hardware and software, making it easy for the user to accelerate development time. An example is UEFI development, where we provide macro files that allow for context-sensitive debugging in the PEIM, DXE and other boot phases.
SourcePoint for Intel Trace eResources

Intel®’s Trace Hub has arrived in the nick of time for faster software debug. Code bases, including UEFI firmware, have gotten so large and so complex that just navigating through instruction trace data to find the root cause of a bug is close to impossible.