

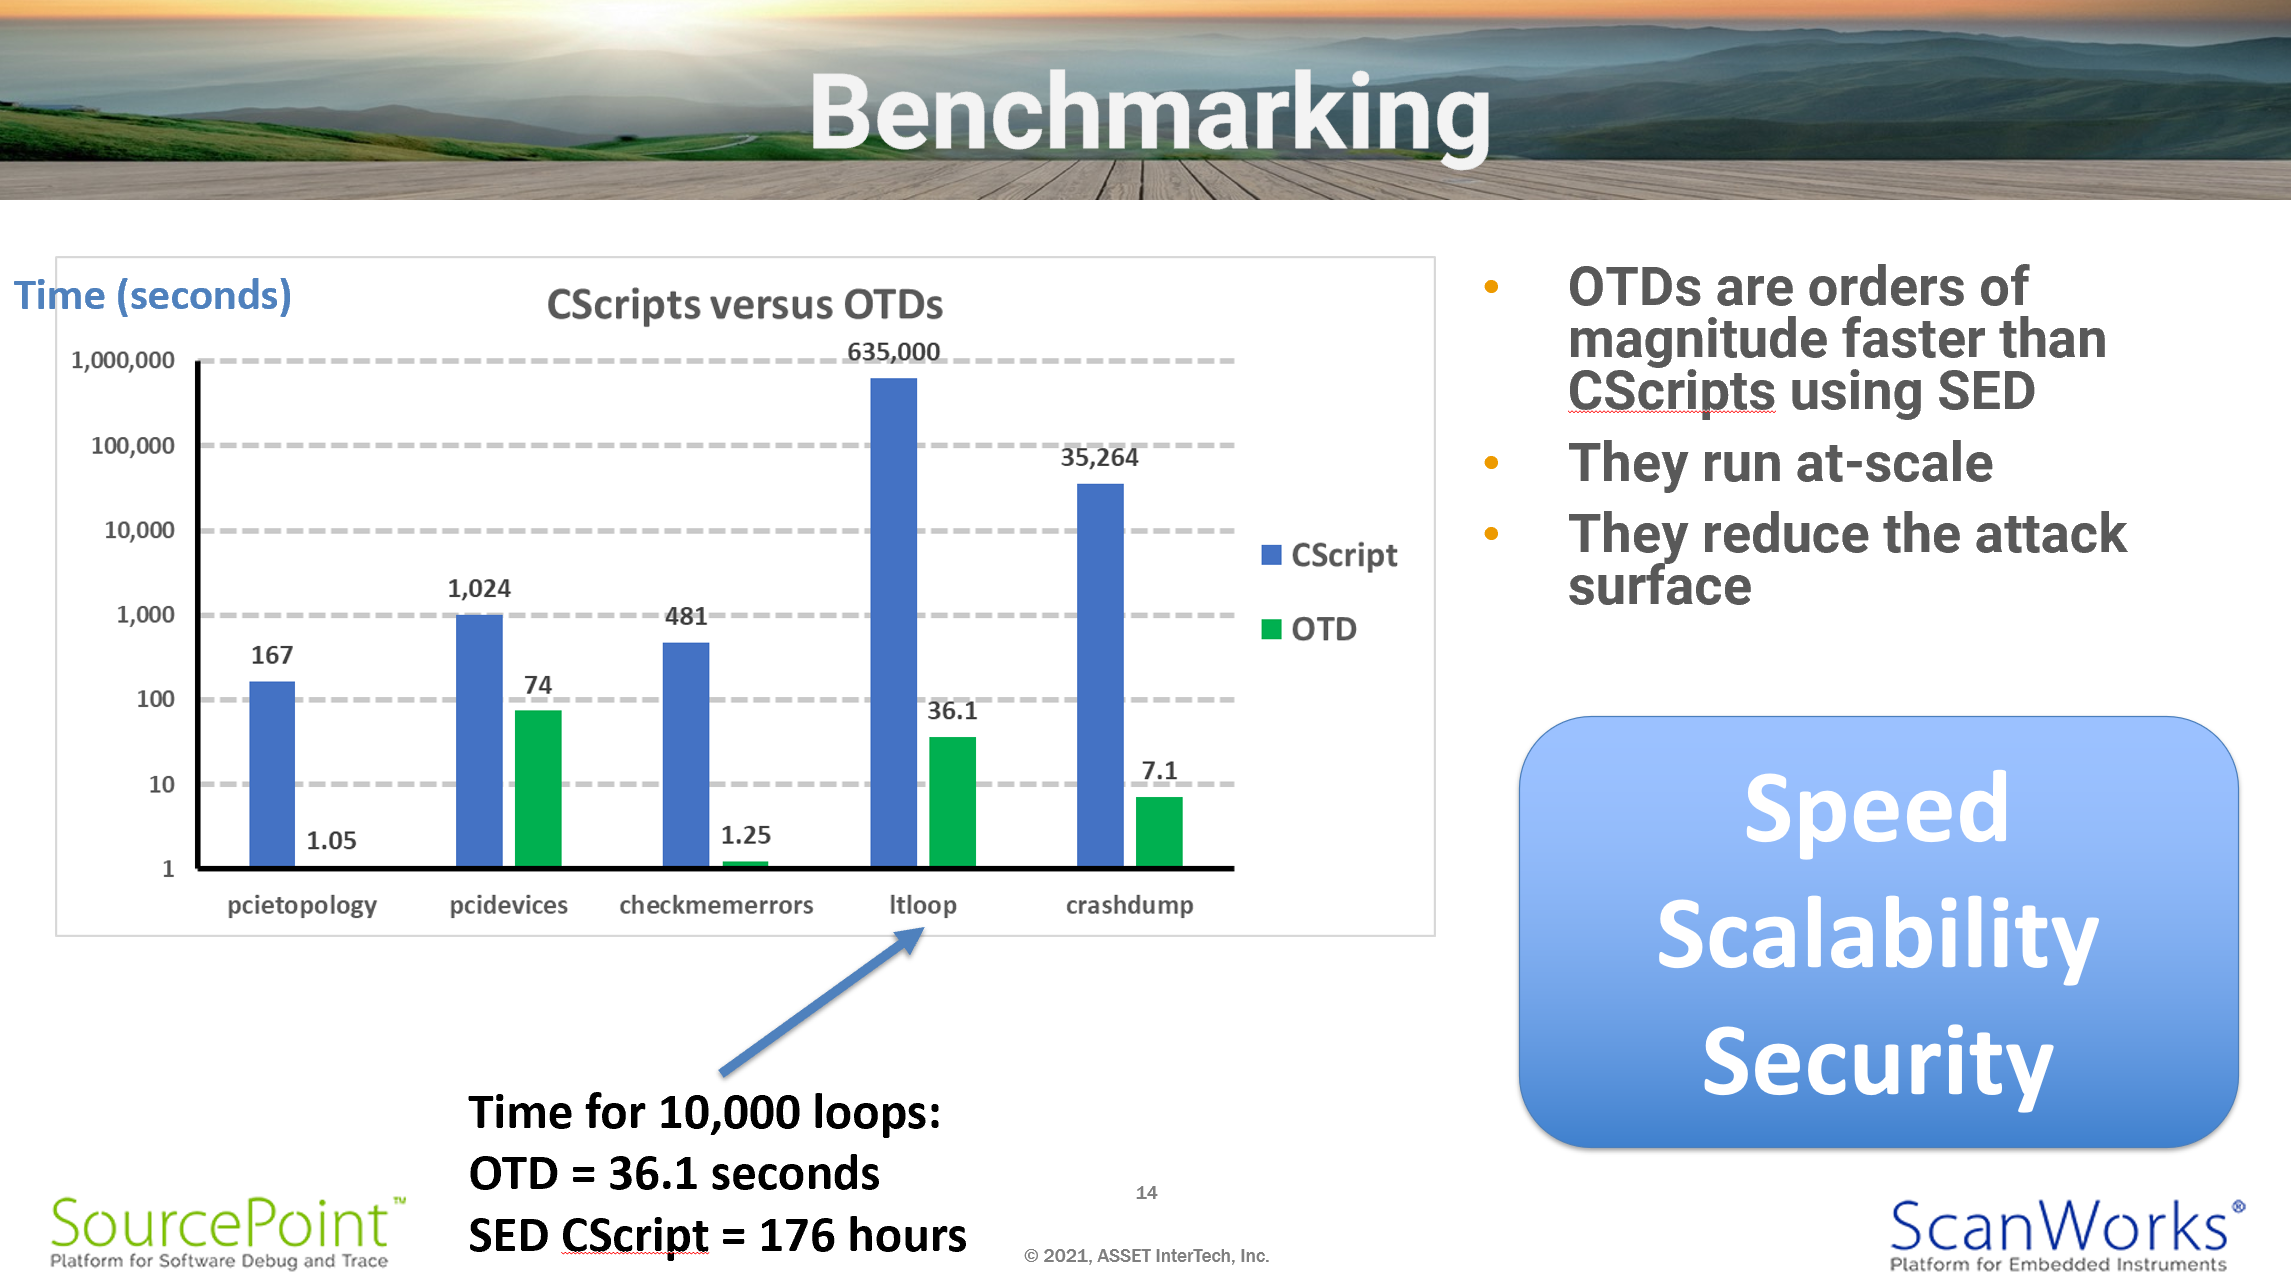
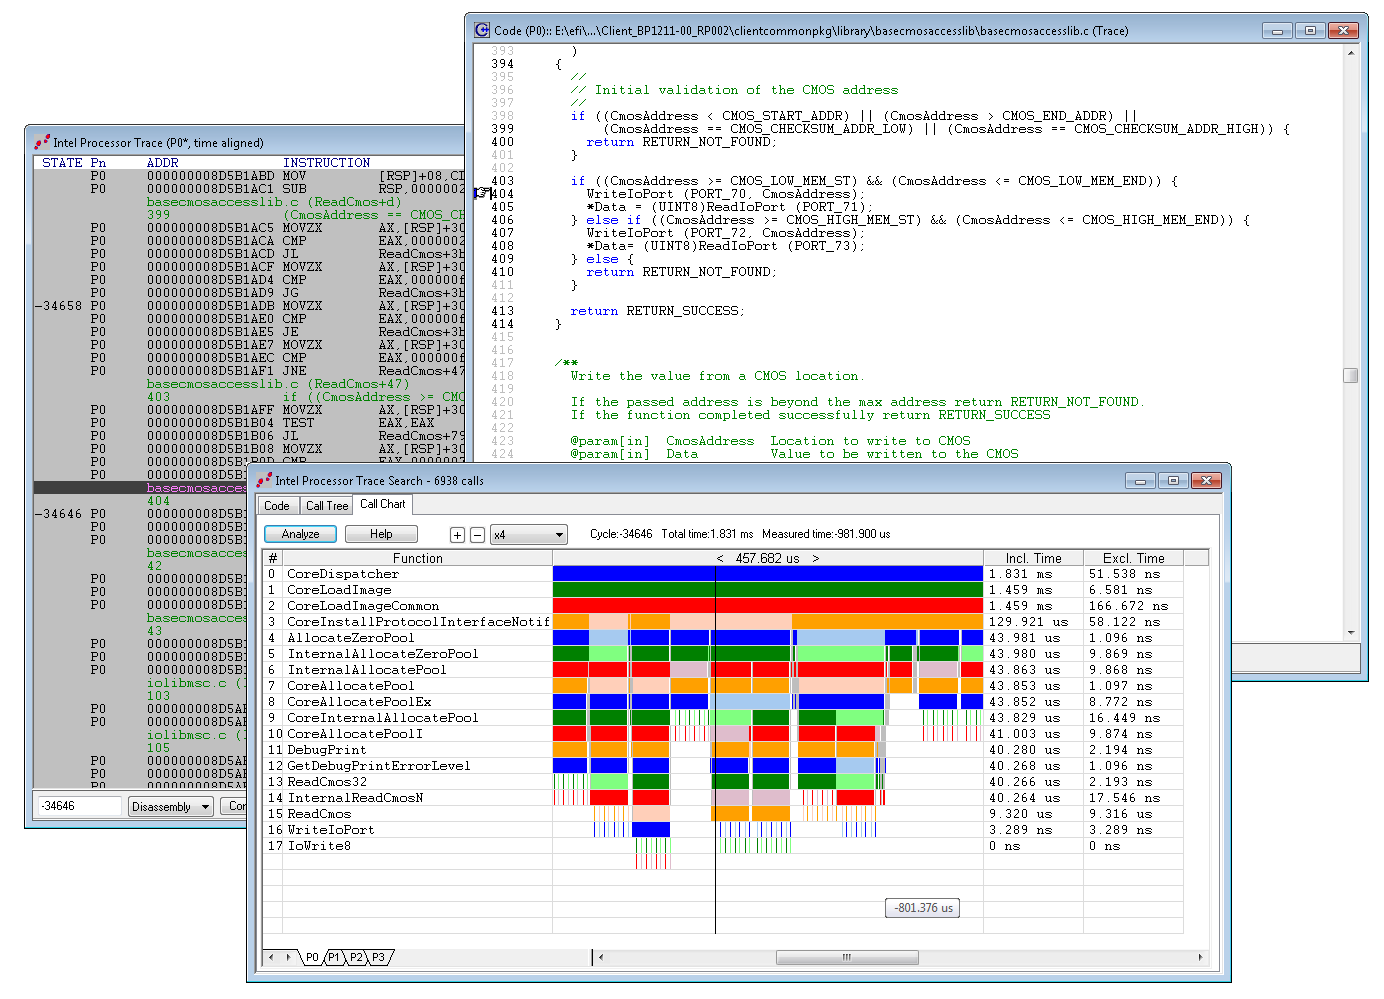
Webinar recording: At-Scale BMC-based debug of x86 servers
Want to see some Intel Python CScripts ported to 'C' and running on a BMC on a live Intel server? This webinar, presented by ASSET's Alan Sguigna, includes a demonstration of embedded JTAG remote debug on a live Intel server platform. You'll see applications like low-level memory error checks, PCIe stress testing, and JTAG-based autonomous crash dump in action.
Webinar recording: JTAG-based debugging of AMD EPYC servers
Datacenter-scale deployment of AMD EPYC processors demands better debugging tools. Low-level firmware issues can manifest themselves in the most intermittent, difficult-to-duplicate bugs. This recorded webinar video demonstrates the advanced use of source-level and symbolic debug tools to identify silicon, hardware, firmware and software issues.
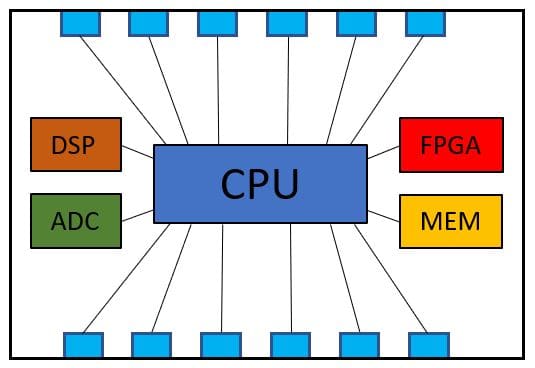
Webinar recording: Chiplet interconnect testing using JTAG/boundary scan
This is the December 2nd, 2020 webinar recording of the use of ScanWorks STIL export functionality to perform chiplet interconnect testing. The use of IEEE 1149.1 and 1149.6 for high-speed interconnect structural testing allows for detection and diagnosis of process issues on chiplet-based designs.
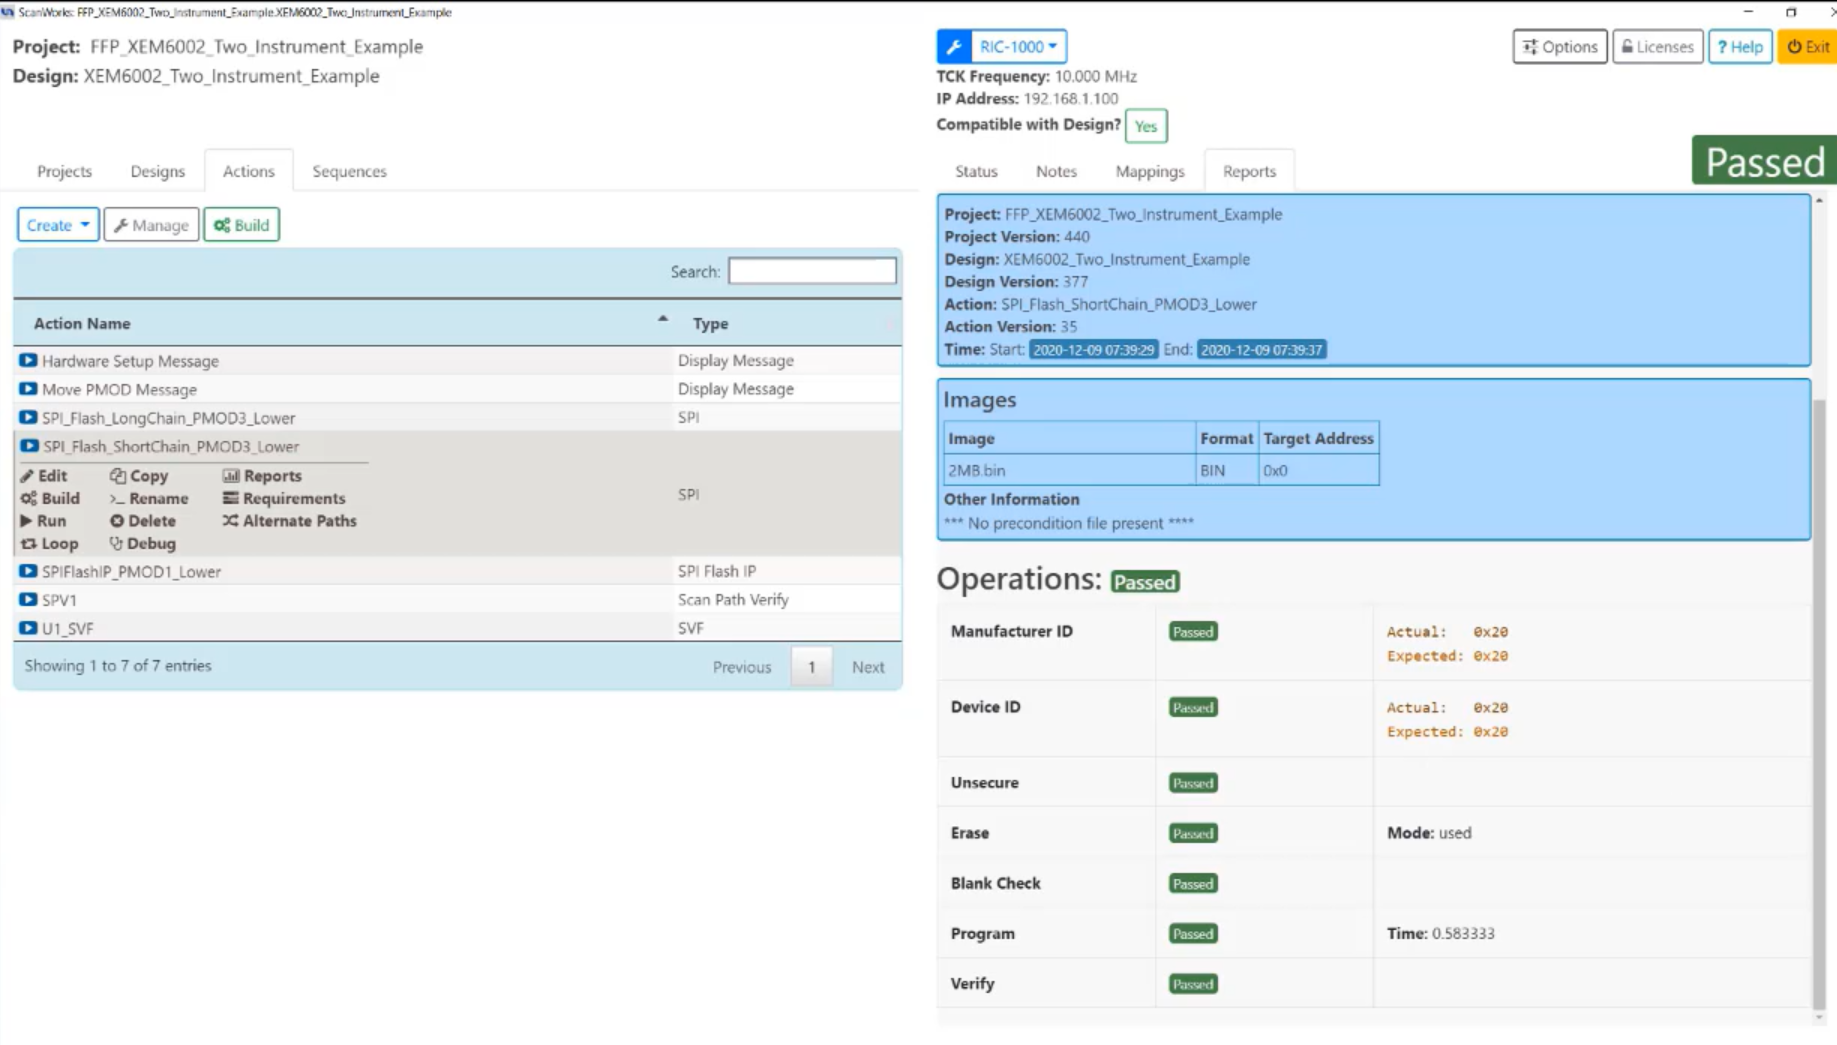
Fast Flash Programming using FPGA IP
JTAG/Boundary Scan is a useful technology for programming flash memories, but it can be slow. This video demonstrates the use of FPGA-based IP to dramatically reduce the time to do device programming...

ScanWorks for Boundary-Scan Test Graphical User Interface Overview
This video demonstrates the value of Boundary-Scan Test software. Test engineers can quickly develop interconnect tests and device-programming actions for use on first prototype board to accelerate the board bring-up process. Then tests can be exported for use in manufacturing and repair facilities.
SourcePoint licensing and installation
This short video walks you through the SourcePoint installation and licensing process.

Processor-based Fast Programming for TI Power Management UCD3138 demo
ScanWorks® Processor-based Fast Programming uses a target agent that is task specific to configure embedded controllers to gain access to the flash components. By using On-Chip Memory (OCM)…
Processor-based Functional Test for DDR Zedboard tune and test
This video will cover DDR calibration or tuning on the Zedboard and follow-up with the DDR testing after applying the tuning results.
SABRE Lite DDR3 Tuning using Processor-based Functional Test for DDR
ScanWorks® Processor-based Functional Test for DDR addresses design and production challenges of tuning, calibration and optimization of DDR settings.
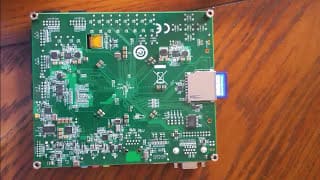
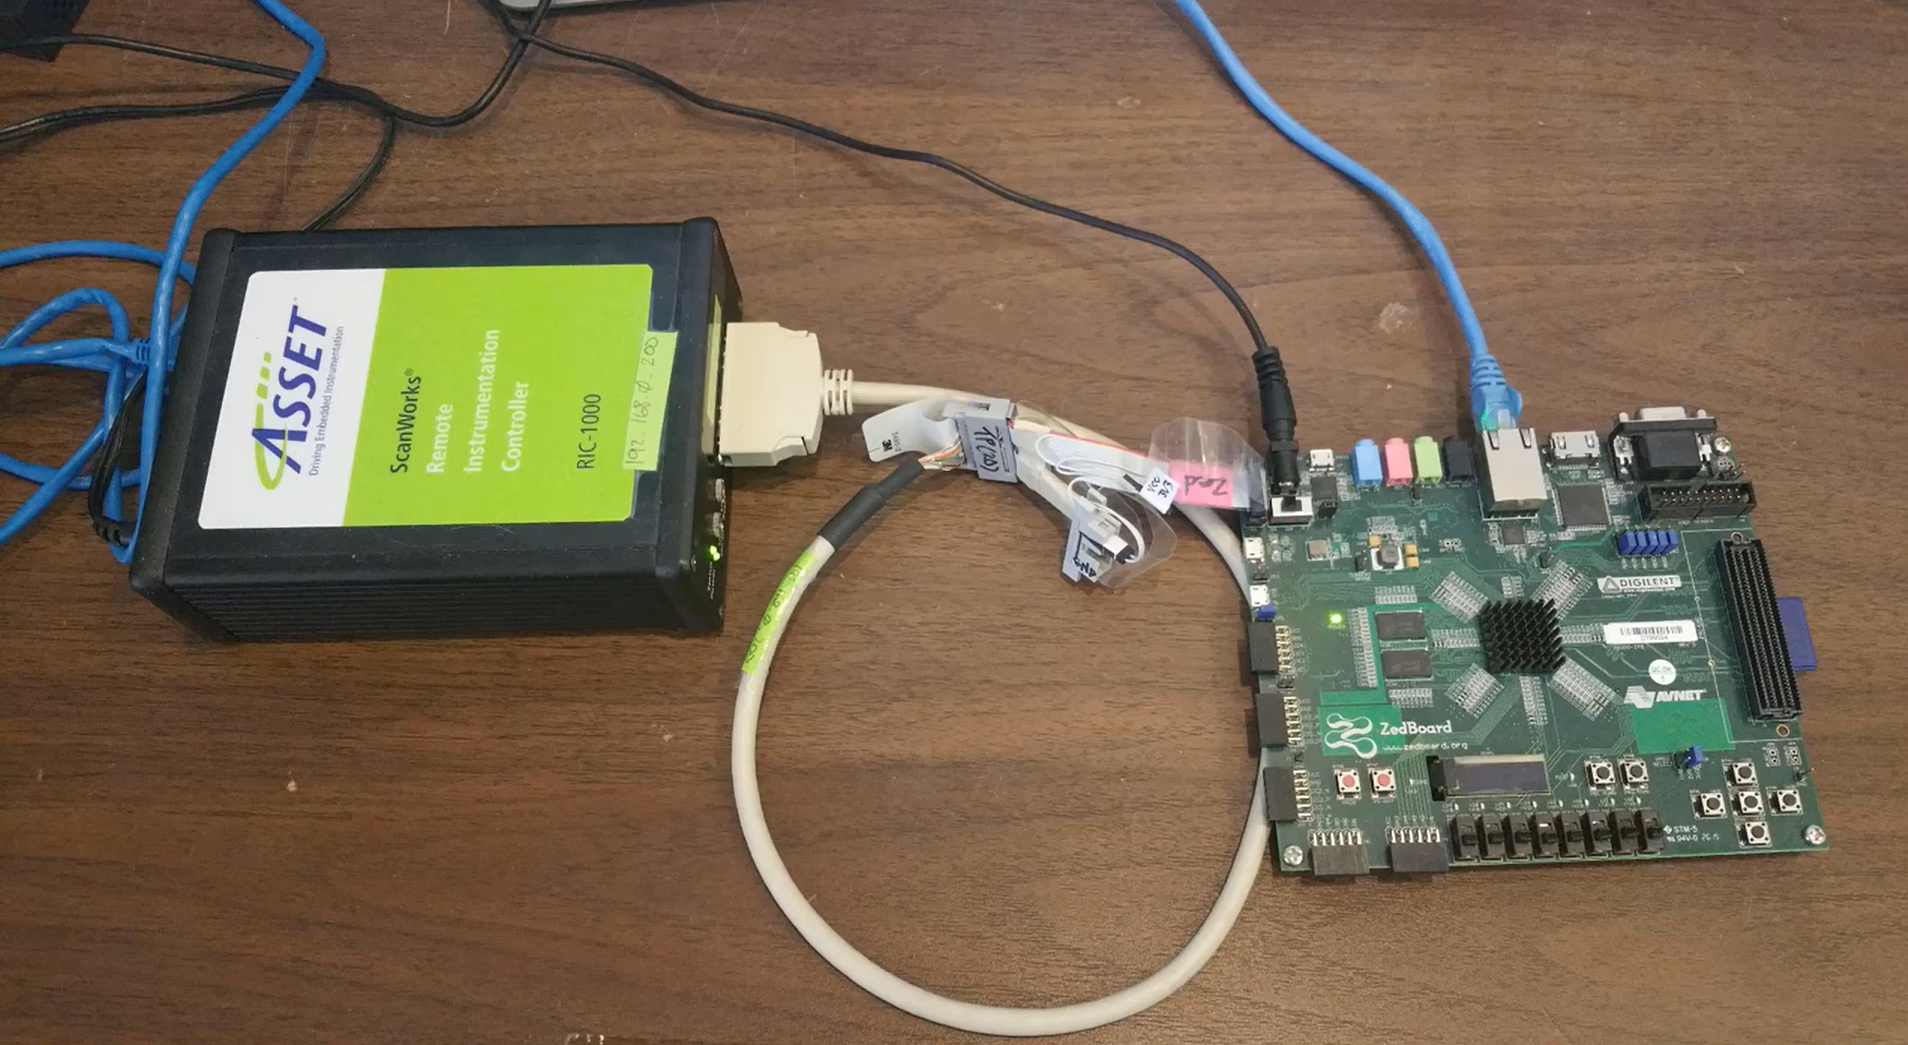
Zedboard episode 3 vlog, part 1
This episode is all about the Zedboard QSPI. Starting with a hardware review of the board, the QPSI device…

Zedboard episode 2 vlog
This episode will cover the DDR initialization via macros, reverse-engineer said macros, explore where in the Xilinx tools to extract the data necessary for debugging, and explore where to find…
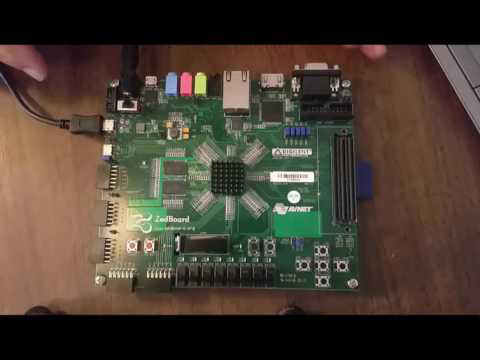
Zedboard episode 1 vlog - with the ASSET SourcePoint debugger
Video Chronicles to explore the Zynq-7000 All Programmable SoC from Xilinx. Episode One covers booting the Zedboard and connecting SourcePoint debugger to the DAP interface and conducting dual core control.
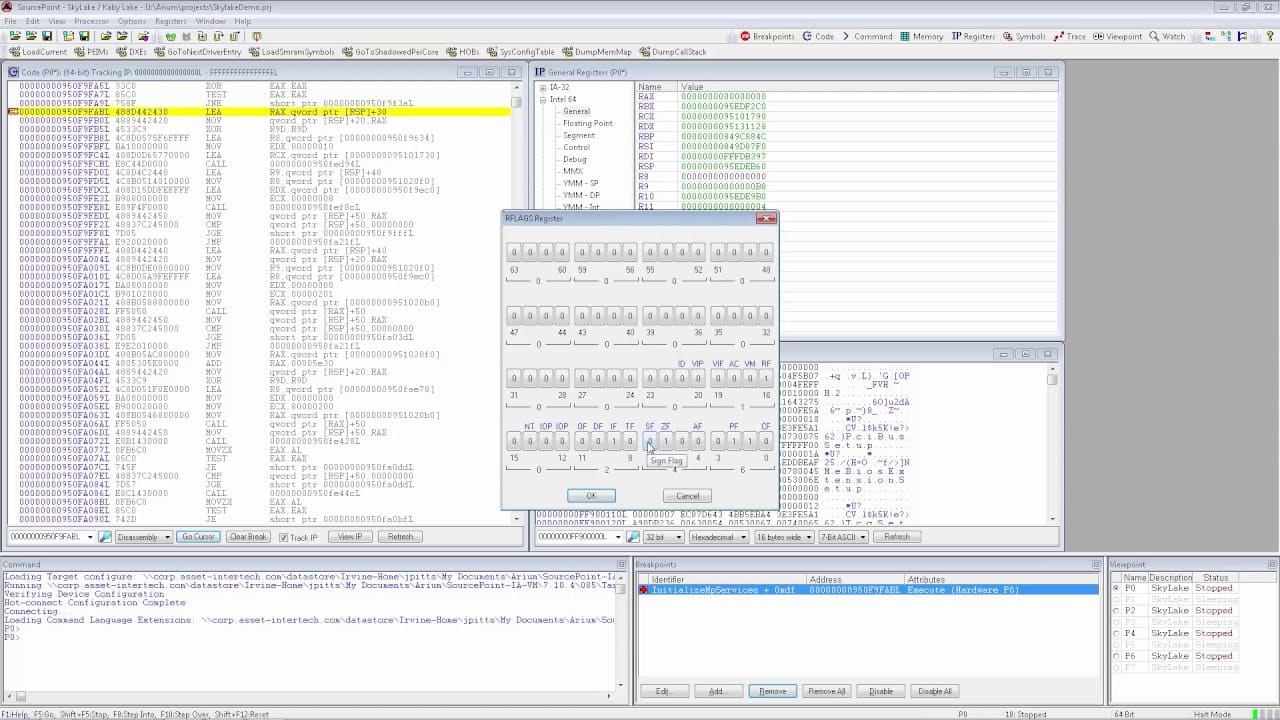
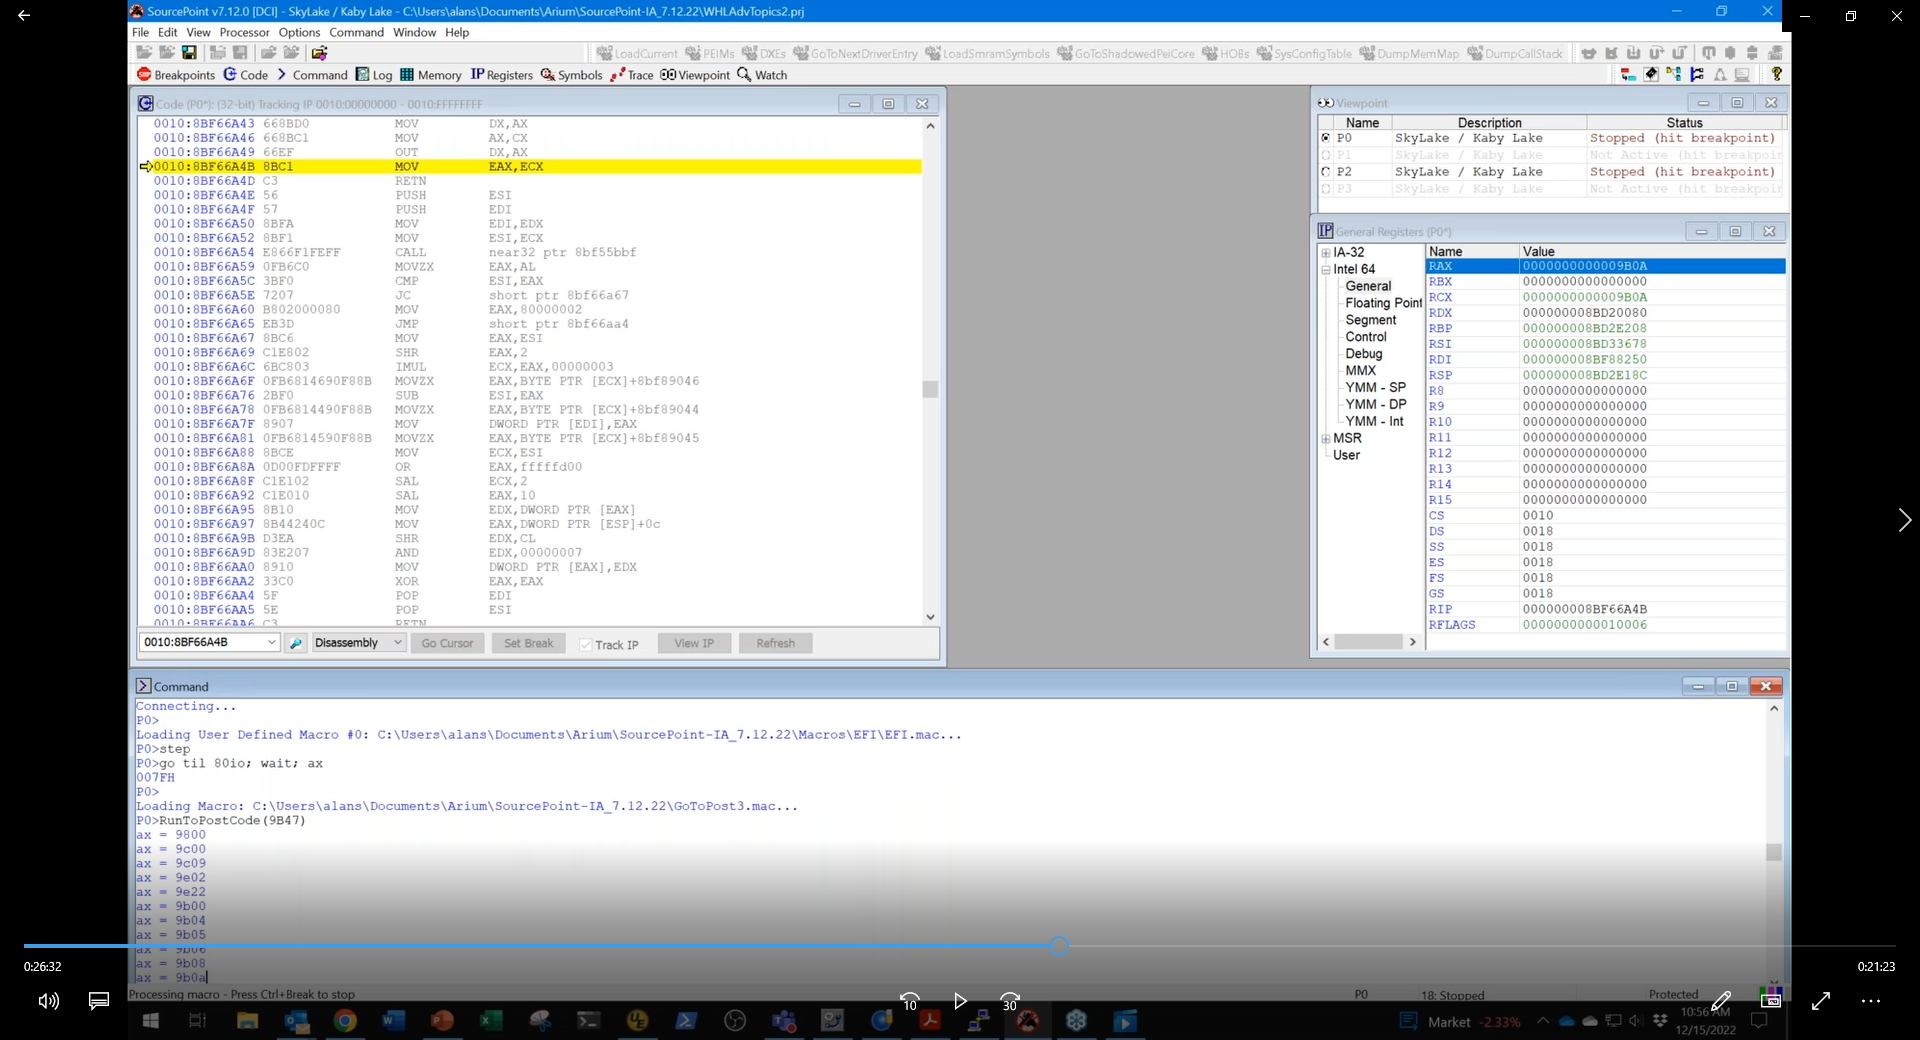
SourcePoint for Intel product demo
This video shows the full SourcePoint GUI, with its source-level debug capabilities.
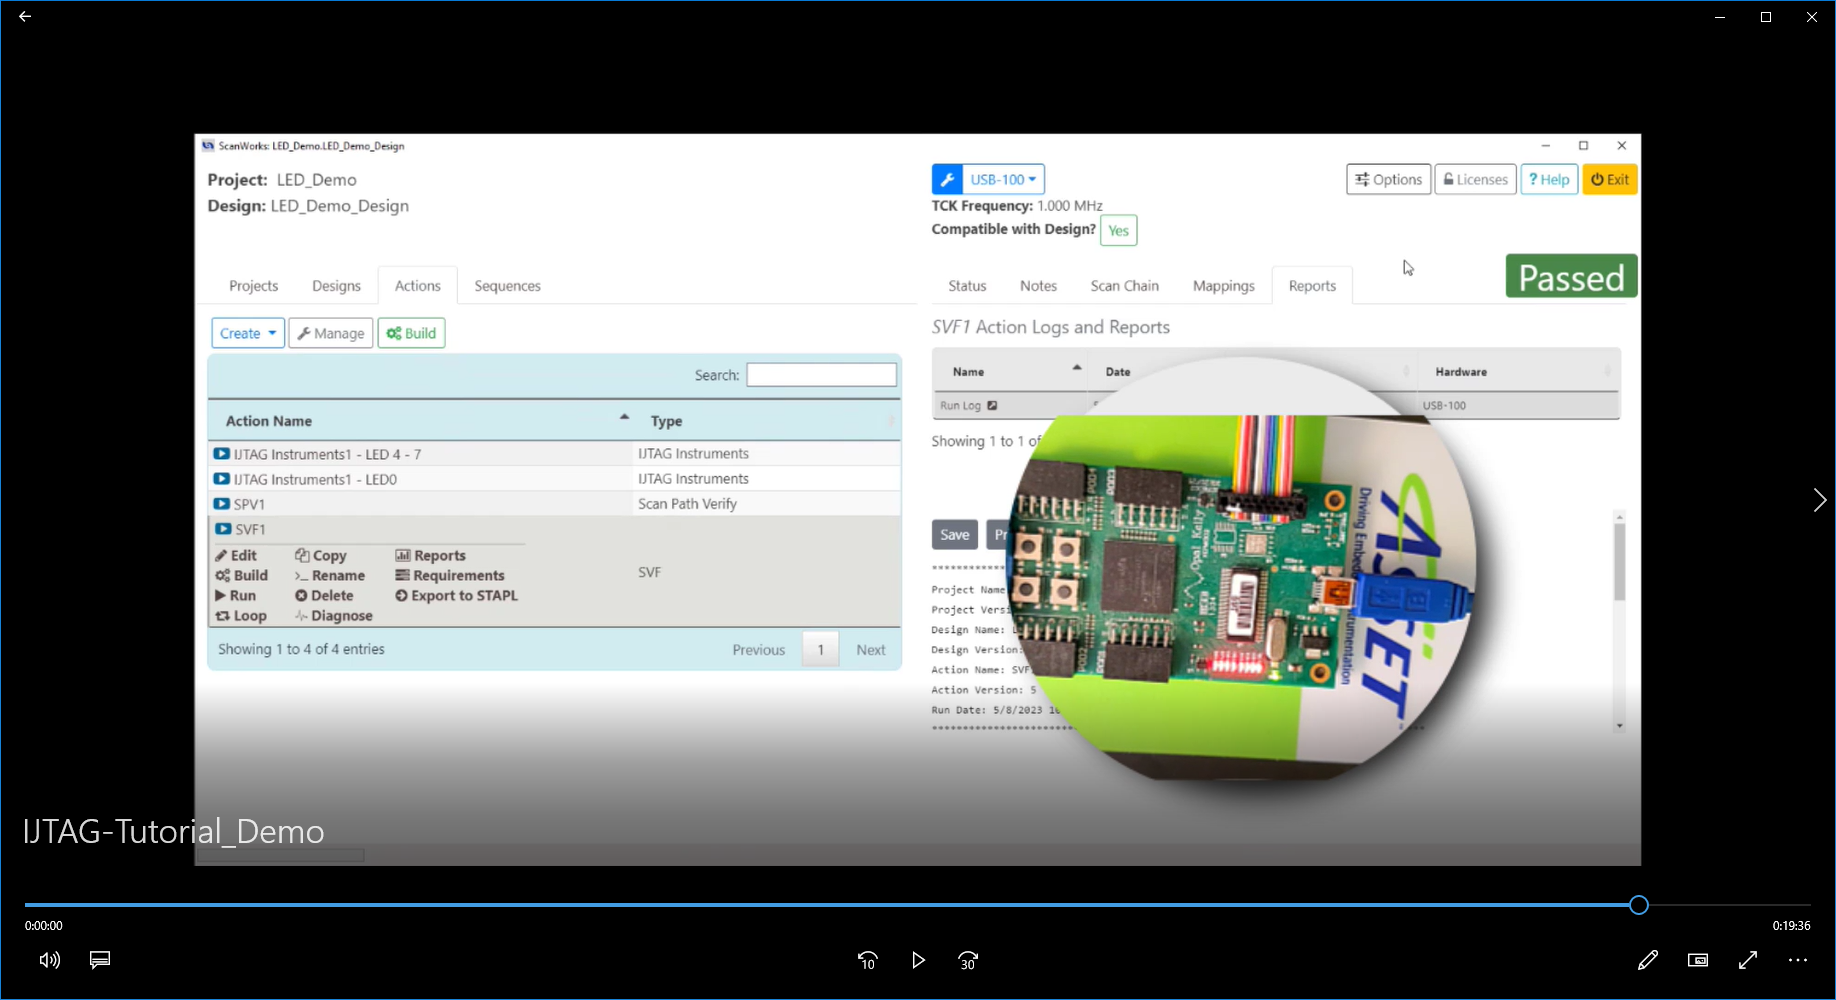
IJTAG Value to Silicon Designers and Board Designers
This video shows the value of IJTAG (IEEE 1687) to the Silicon Designer and the Board Designers. There is no audio on this video.
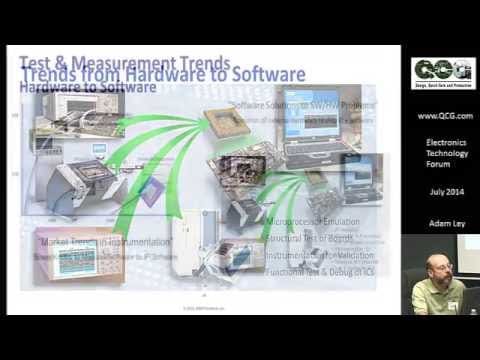
Embedded Instrumentation Trends Drive Non-intrusive Board Test
By Electronics Technology Forum*: With growing circuit density, comes greater complexity and…

ASSET | Arium - ARM tools: new synergies, more value, part 3
Software debug tools for ARM processors in SoCs including enhancements to ARM’s System Trace Macrocell (STM) and others will be the outcome of the recent merging of ASSET InterTech and Arium. The…
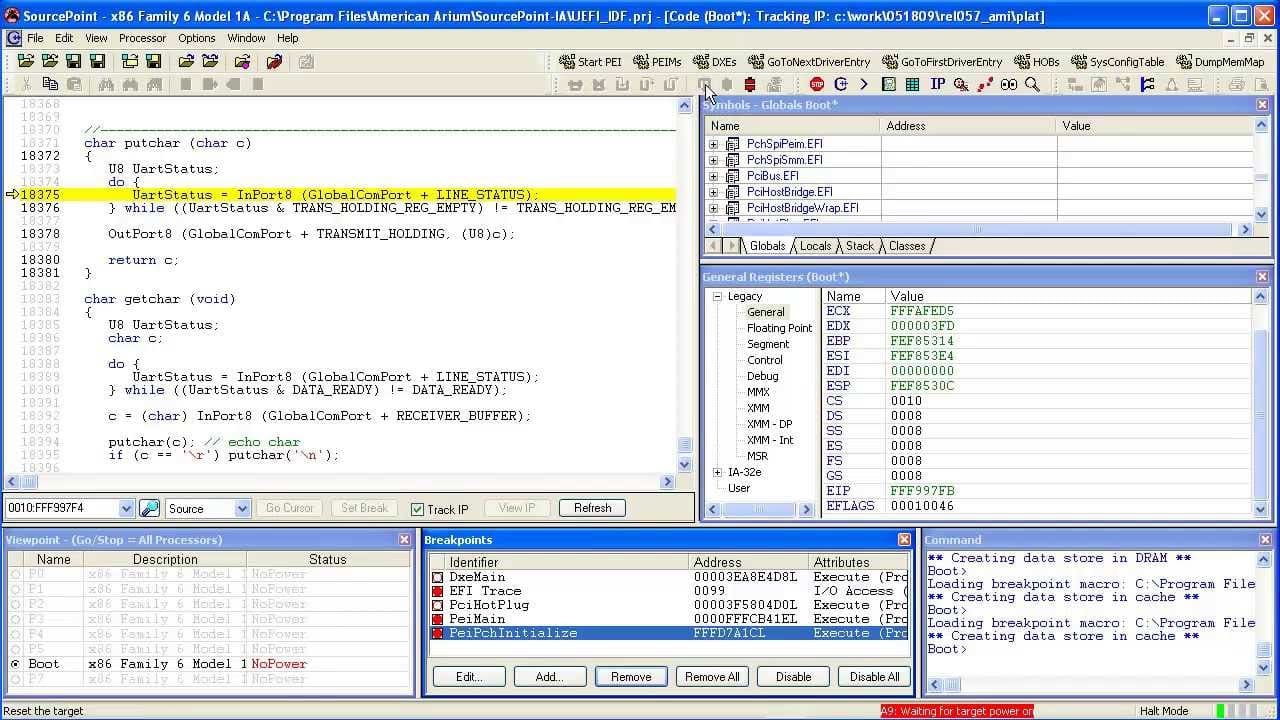
More Visibility into Arium SourcePoint UEFI debugging
Using SourcePoint® to empower the developer to debug UEFI code quickly and find the root cause to execution problems. BIOS development was an art and now more of a science but a complex…

ASSET | Arium - Embedded instrumentation trends, part 2
From software debug to hardware test and validation, the scope of embedded instrumentation has continued to expand. Glenn Woppman, president and CEO of ASSET InterTech, discusses how an inside-out

ASSET and Arium Merge - track and trace
Track & Trace of soft and hard problems in boards and SoC’s. Stronger support for Intel and ARM based designs. The ScanWorks platform breaks new ground with the SourcePoint software debug…
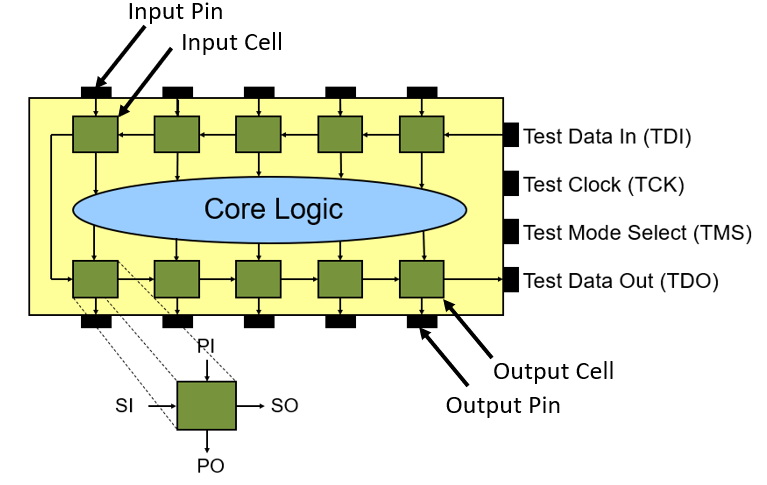
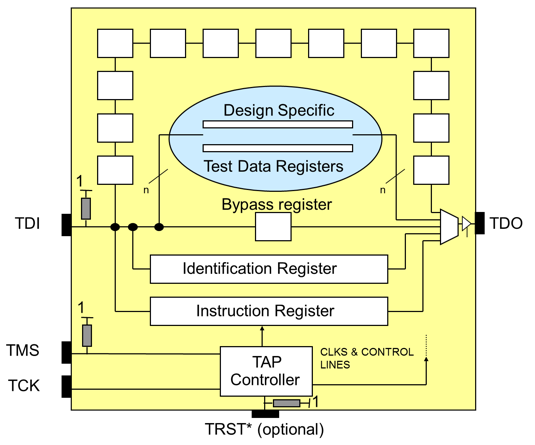
ScanWorks® Non-intrusive Board Test (NBT)
ScanWorks® Non-intrusive Board Test (NBT) from ASSET InterTech is a comprehensive solution for testing, debugging and validating the latest circuit boards that use highly-integrated,…

ScanWorks® Embedded Diagnostics
ASSET’s ScanWorks® Embedded Diagnostics solution improves the reliability of high-availability and mission-critical systems. It allows the root causes of hardware and software failures to be…