Table of Contents
- Using Help
- Contacting ASSET InterTech
- Introduction to SourcePoint
- SourcePoint Environment
- SourcePoint Overview
- SourcePoint Parent Window Introduction
- SourcePoint Icon Toolbar
- File Menu
- File Menu - Project Menu Item
- File Menu - Layout Menu Item
- File Menu - Program Menu Item
- File Menu - Macro Menu Item
- File Menu - Print Menu Items
- File Menu - Update Emulator Flash Menu Item
- File Menu - Program Target Device Menu Item
- File Menu - Other Menu Items
- Edit Menu
- View Menu
- Processor Menu
- Options Menu
- Options Menu - Preferences Menu Item
- Options Menu - Target Configuration Menu Item
- Options Menu - Load Target Configuration File Menu Item
- Options Menu - Save Target Configuration File Menu Item
- Options Menu - Emulator Configuration Menu Item
- Options Menu - Emulator Connection Menu Item
- Options Menu - Emulator Reset Menu Item
- Options Menu - Confidence Tests Menu Item
- Window Menu
- Help Menu
- How To -- SourcePoint Environment
- Add Emulator Connections
- Configure Custom Macro Icons
- Configure Autoloading Macros
- Display Text on the Icon Toolbar
- Edit Icon Groups to Customize Your Toolbars
- Modify a Defined Memory Region
- Refresh SourcePoint Windows
- Save a Program
- Start SourcePoint With Command Line Arguments
- Use the New Project Wizard
- Verify Emulator Network Connections
- SourcePoint Overview
- Breakpoints Window
- Breakpoints Window Overview
- How To - Breakpoints
- Code Window
- Command Window
- Command Window Overview
- Confidence Tests Window
- Confidence Tests Window Overview
- Descriptors Tables Window
- Descriptors Tables Window Overview
- How To - Descriptors
- Devices Window
- Devices Window Overview
- How To - Devices Window
- Log Window
- Log Window Overview
- Memory Window
- Memory Window Overview
- How To - Memory Window
- Page Translation Window
- Page Translation Windows Overview
- PCI Devices Window
- PCI Devices Window Overview
- How To - PCI Devices Window
- Registers Window
- Registers Window Overview
- How To - Registers
- Symbols Windows
- Symbols Window Overview
- How To - Symbols Window
- Trace Window
- Trace Window Overview
- How To - Trace Window
- Advanced
- Viewpoint Window
- Viewpoint Window Overview
- Watch Window
- Watch Window Overview
- How To - Watch Window
- Technical Notes
- Descriptor Cache: Revealing Hidden Registers
- UEFI Framework Debugging
- Memory Casting
- Microsoft PE Format Support in SourcePoint
- Multi-Clustering
- Python/CScripts
- OpenIPC Integration, Installation and Usage
- Registers Keyword Table
- SourcePoint Licensing
- Stepping
- Symbols Textsym Format
- Target Configuration
- Using Bookmarks
- Which Processor Is Which
- Getting Started with DbC
- SourcePoint Command Language
- Overview
- Commands and Control Variables
- aadump
- abort
- abs
- acos
- advanced
- asin
- asm
- asmmode
- atan
- atan2
- autoconfigure
- base
- bell (beep)
- bits
- break
- breakall
- cachememory
- cause
- Character Functions
- clock
- continue
- cos
- cpubreak commands
- cpuid_eax
- cpuid_ebx
- cpuid_ecx
- cpuid_edx
- createprocess
- cscfg, local_cscfg
- csr
- ctime
- cwd
- dbgbreak commands
- defaultpath
- #define
- define
- definemacro
- deviceconfigure
- devicelist
- devicescan
- disconnect
- displayflag
- do while
- dos
- dport
- drscan
- edit
- editor
- emubreak, emuremove, emudisable, emuenable
- emulatorstate
- encrypt
- error
- eval
- evalprogramsymbol
- execution point ($)
- exit
- exp
- fc
- fclose
- feof
- fgetc
- fgets
- first_jtag_device
- flist
- flush
- fopen
- for
- forward
- fprintf
- fputc
- fputs
- fread
- fseek
- ftell
- fwrite
- getc
- getchar
- getnearestprogramsymbol
- getprogramsymboladdress
- gets
- globalsourcepath
- go
- halt
- help
- homepath
- idcode
- if
- include
- invd
- irscan
- isdebugsymbol
- isem64t
- isprogramsymbol
- isrunning
- issleeping
- issmm
- itpcompatible
- jtagchain
- jtagconfigure
- jtagdeviceadd
- jtagdeviceclear
- jtagdevices
- jtagscan
- jtagtest
- keys
- last
- last_jtag_device
- left
- libcall
- license
- linear
- list, nolist
- load
- loadbreakpoints
- loadlayout
- loadproject
- loadtarget
- loadwatches
- log, nolog
- log10
- loge
- logmessage
- macropath
- Memory Access
- messagebox
- mid
- msgclose
- msgdata
- msgdelete
- msgdr
- msgdump
- msgir
- msgopen
- msgreturndatasize
- msgscan
- msr
- num_activeprocessors
- num_all_devices
- num_devices
- num_jtag_chains
- num_jtag_devices
- num_processors
- num_uncore_devices
- openipc
- pause
- physical
- port
- pow
- print cycles
- printf
- proc
- processorcontrol
- processorfamily
- processormode
- processors
- processortype
- projectpath
- putchar
- puts
- rand
- readsetting
- reconnect
- Register Access
- reload
- reloadproject
- remove
- reset
- restart
- return
- right
- runcontroltype
- safemode
- save
- savebreakpoints
- savelayout
- savewatches
- selectdirectory
- selectfile
- shell
- show
- sin
- sizeof
- sleep
- softbreak, softremove, softdisable, softenable
- sprintf
- sqrt
- srand
- step
- stop
- strcat
- strchr
- strcmp
- strcpy
- _strdate
- string [ ] (index into string)
- strlen
- _strlwr
- strncat
- strncmp
- strncpy
- strpos
- strstr
- _strtime
- strtod
- strtol
- strtoul
- _strupr
- swbreak
- switch
- swremove
- tabs
- tan
- tapdatashift
- tapstateset
- targpower
- targstatus
- taskattach
- taskbreak, taskremove, taskdisable, taskenable
- taskend
- taskgetpid
- taskstart
- tck
- time
- uncoreconfigure
- uncorescan
- #undef
- unload
- unloadproject
- upload
- use
- verify
- verifydeviceconfiguration
- verifyjtagconfiguration
- version
- viewpoint
- vpalias
- wait
- wbinvd
- while
- windowrefresh
- wport
- writesetting
- yield
- yieldflag
Trace Display Settings
The Display button in the Trace window opens the Trace Display Settings dialog box. This dialog is used to configure the display format of the Trace window.
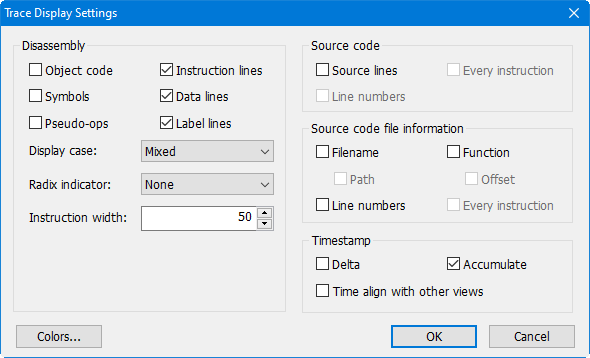
Disassembly section
Object code. When selected, adds object code bytes prior to the disassembled instruction display. The default is disabled.
Symbols. When selected, replaces numeric address operands with symbolic addresses in the disassembled instruction display. The default is disabled.
Pseudo-ops. Enables the display of pseudo-ops (e.g., far ptr, near ptr, byte ptr, etc.)
Instruction lines. Enables the display of disassembled instruction lines.
Data lines (Event trace only). Enables the display of data values for I/O and MSR events.
Label lines. Enables the display of informational lines (best if enabled).
Display Case. Options are Mixed, Upper, and Lower.
Radix Indicators. Options are Prefix, Suffix, and None.
Source Code section
These checkboxes control the display of source lines in the Trace view.
Source lines. When selected, enables the display of source code in the Trace view. The default is disabled.
Line numbers. When selected, the line number of the source line is also displayed. The default is disabled.
Every instruction. When selected, source lines are displayed for every disassembled instruction rather than the first instruction of a group (the first instruction after a branch). The default is disabled.
Source Code File Information section
These controls allow the display of source file information corresponding to the disassembled trace data.
Filename. When selected, the source filename is displayed. The default is disabled.
Path. When selected, the full path of the source filename is displayed. The default is disabled.
Line numbers. When selected, line numbers are displayed. The default is disabled.
Function. When selected, function names are displayed. The default is disabled.
Offset. When selected, function offsets are displayed. The default is disabled.
Every instruction. When selected, source file information is displayed for every line of disassembly. The default is disabled.
Timestamp Section
These controls allow you to configure timestamp display (BTS and Event trace only).
Delta. This option displays the time between cycles.
Accumulate. This option displays the accumulated time from a given point (by default, the trigger location). This point can be changed by selecting zero timestamp in the Trace window menu.
Time Align with Other Views. This option enables multiple trace views to track each other. When a tracking Trace window is scrolled, all other tracking windows will automatically scroll to show the same area of trace. Timestamp data is used to perform the alignment. A common example is to have one Trace window display BTS trace and another Trace window display Event trace, and have them both set to track each other.
Colors. A shortcut to the Colors tab under Options | Preferences. This allows for changing the colors (including processor background colors) in the Trace view.