Table of Contents
- Using Help
- Contacting ASSET InterTech
- Introduction to SourcePoint
- SourcePoint Environment
- SourcePoint Overview
- SourcePoint Parent Window Introduction
- SourcePoint Icon Toolbar
- File Menu
- File Menu - Project Menu Item
- File Menu - Layout Menu Item
- File Menu - Program Menu Item
- File Menu - Macro Menu Item
- File Menu - Print Menu Items
- File Menu - Update Emulator Flash Menu Item
- File Menu - Program Target Device Menu Item
- File Menu - Other Menu Items
- Edit Menu
- View Menu
- Processor Menu
- Options Menu
- Options Menu - Preferences Menu Item
- Options Menu - Target Configuration Menu Item
- Options Menu - Load Target Configuration File Menu Item
- Options Menu - Save Target Configuration File Menu Item
- Options Menu - Emulator Configuration Menu Item
- Options Menu - Emulator Connection Menu Item
- Options Menu - Emulator Reset Menu Item
- Options Menu - Confidence Tests Menu Item
- Window Menu
- Help Menu
- How To -- SourcePoint Environment
- Add Emulator Connections
- Configure Custom Macro Icons
- Configure Autoloading Macros
- Display Text on the Icon Toolbar
- Edit Icon Groups to Customize Your Toolbars
- Modify a Defined Memory Region
- Refresh SourcePoint Windows
- Save a Program
- Start SourcePoint With Command Line Arguments
- Use the New Project Wizard
- Verify Emulator Network Connections
- SourcePoint Overview
- Breakpoints Window
- Breakpoints Window Overview
- How To - Breakpoints
- Code Window
- Command Window
- Command Window Overview
- Confidence Tests Window
- Confidence Tests Window Overview
- Descriptors Tables Window
- Descriptors Tables Window Overview
- How To - Descriptors
- Devices Window
- Devices Window Overview
- How To - Devices Window
- Log Window
- Log Window Overview
- Memory Window
- Memory Window Overview
- How To - Memory Window
- Page Translation Window
- Page Translation Windows Overview
- PCI Devices Window
- PCI Devices Window Overview
- How To - PCI Devices Window
- Registers Window
- Registers Window Overview
- How To - Registers
- Symbols Windows
- Symbols Window Overview
- How To - Symbols Window
- Trace Window
- Trace Window Overview
- How To - Trace Window
- Advanced
- Viewpoint Window
- Viewpoint Window Overview
- Watch Window
- Watch Window Overview
- How To - Watch Window
- Technical Notes
- Descriptor Cache: Revealing Hidden Registers
- UEFI Framework Debugging
- Memory Casting
- Microsoft PE Format Support in SourcePoint
- Multi-Clustering
- Python/CScripts
- OpenIPC Integration, Installation and Usage
- Registers Keyword Table
- SourcePoint Licensing
- Stepping
- Symbols Textsym Format
- Target Configuration
- Using Bookmarks
- Which Processor Is Which
- Getting Started with DbC
- SourcePoint Command Language
- Overview
- Commands and Control Variables
- aadump
- abort
- abs
- acos
- advanced
- asin
- asm
- asmmode
- atan
- atan2
- autoconfigure
- base
- bell (beep)
- bits
- break
- breakall
- cachememory
- cause
- Character Functions
- clock
- continue
- cos
- cpubreak commands
- cpuid_eax
- cpuid_ebx
- cpuid_ecx
- cpuid_edx
- createprocess
- cscfg, local_cscfg
- csr
- ctime
- cwd
- dbgbreak commands
- defaultpath
- #define
- define
- definemacro
- deviceconfigure
- devicelist
- devicescan
- disconnect
- displayflag
- do while
- dos
- dport
- drscan
- edit
- editor
- emubreak, emuremove, emudisable, emuenable
- emulatorstate
- encrypt
- error
- eval
- evalprogramsymbol
- execution point ($)
- exit
- exp
- fc
- fclose
- feof
- fgetc
- fgets
- first_jtag_device
- flist
- flush
- fopen
- for
- forward
- fprintf
- fputc
- fputs
- fread
- fseek
- ftell
- fwrite
- getc
- getchar
- getnearestprogramsymbol
- getprogramsymboladdress
- gets
- globalsourcepath
- go
- halt
- help
- homepath
- idcode
- if
- include
- invd
- irscan
- isdebugsymbol
- isem64t
- isprogramsymbol
- isrunning
- issleeping
- issmm
- itpcompatible
- jtagchain
- jtagconfigure
- jtagdeviceadd
- jtagdeviceclear
- jtagdevices
- jtagscan
- jtagtest
- keys
- last
- last_jtag_device
- left
- libcall
- license
- linear
- list, nolist
- load
- loadbreakpoints
- loadlayout
- loadproject
- loadtarget
- loadwatches
- log, nolog
- log10
- loge
- logmessage
- macropath
- Memory Access
- messagebox
- mid
- msgclose
- msgdata
- msgdelete
- msgdr
- msgdump
- msgir
- msgopen
- msgreturndatasize
- msgscan
- msr
- num_activeprocessors
- num_all_devices
- num_devices
- num_jtag_chains
- num_jtag_devices
- num_processors
- num_uncore_devices
- openipc
- pause
- physical
- port
- pow
- print cycles
- printf
- proc
- processorcontrol
- processorfamily
- processormode
- processors
- processortype
- projectpath
- putchar
- puts
- rand
- readsetting
- reconnect
- Register Access
- reload
- reloadproject
- remove
- reset
- restart
- return
- right
- runcontroltype
- safemode
- save
- savebreakpoints
- savelayout
- savewatches
- selectdirectory
- selectfile
- shell
- show
- sin
- sizeof
- sleep
- softbreak, softremove, softdisable, softenable
- sprintf
- sqrt
- srand
- step
- stop
- strcat
- strchr
- strcmp
- strcpy
- _strdate
- string [ ] (index into string)
- strlen
- _strlwr
- strncat
- strncmp
- strncpy
- strpos
- strstr
- _strtime
- strtod
- strtol
- strtoul
- _strupr
- swbreak
- switch
- swremove
- tabs
- tan
- tapdatashift
- tapstateset
- targpower
- targstatus
- taskattach
- taskbreak, taskremove, taskdisable, taskenable
- taskend
- taskgetpid
- taskstart
- tck
- time
- uncoreconfigure
- uncorescan
- #undef
- unload
- unloadproject
- upload
- use
- verify
- verifydeviceconfiguration
- verifyjtagconfiguration
- version
- viewpoint
- vpalias
- wait
- wbinvd
- while
- windowrefresh
- wport
- writesetting
- yield
- yieldflag
Trace Configuration
The Configure button in the Trace window opens the Trace Configuration dialog box. This dialog is used to configure trace capture settings. Changes in this dialog take effect on the next trace capture.
Emulator Tab
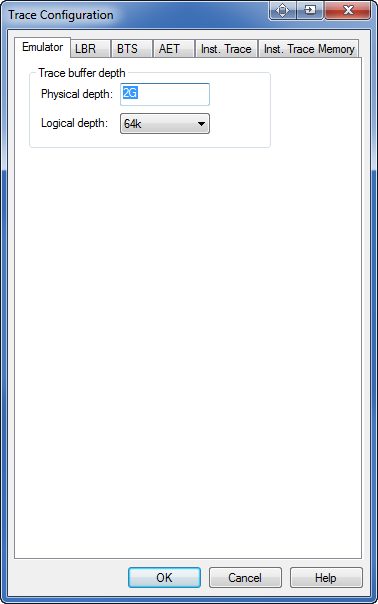
Emulator Configuration Tab
The emulator tab configures settings specific to emulator. It will only be displayed if you have an emulator with hardware trace support (e.g., LX-1000).
Trace buffer depth section
Physical depth. Displays the amount of trace RAM installed in the emulator. This is a read-only field.
Logical depth. Sets the logical trace depth. This makes it look like the trace buffer is actually much smaller than it really is. One advantage of this is trace cycle numbers can be 5 or 6 digits instead of 10. Another is that searching the entire trace is much faster.
Note: This setting has no effect on the actual recording of trace. If you record a full trace buffer (e.g., 2 Gb), and have a logical trace depth of 64k, there is still 2 Gb of trace data in the emulator. This setting can be changed to different values without having to record new trace data.
LBR Tab
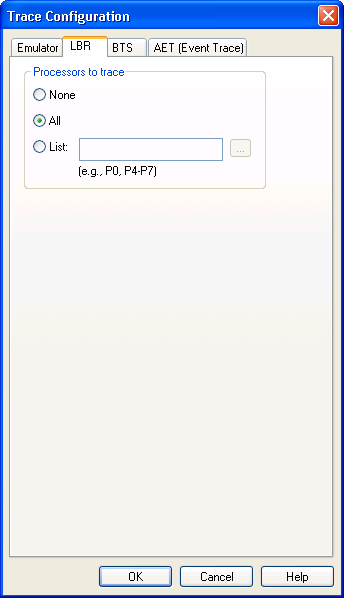
LBR Configuration Tab
Processors to trace section
These controls specify which processors will be traced.
None. Disables LBR trace.
All. Enables LBR tracing on all processors.
List. Enables LBR processor tracing on selected processors. Use commas to list processors (e.g., P2, P4, P6). Use a hyphen to specify a range of processors (e.g., P0-P4). Press the Browse button to the right to graphically specify processors.
BTS tab
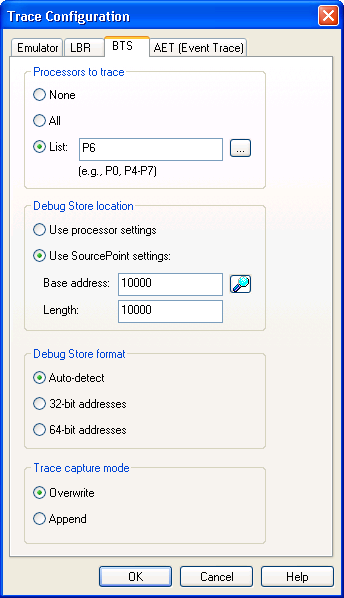
BTS Configuration Tab
Processors to trace section
These controls specify which processors will be traced.
None. Disables BTS trace.
All. Enables BTS tracing on all processors.
List. Enables BTS processor tracing on selected processors. Use commas to list processors (e.g., P2, P4, P6). Use a hyphen to specify a range of processors (e.g., P0-P4). Press the Browse button to the right to graphically specify processors.
Debug Store Location section
When ”Use processor settings” is selected, SourcePoint takes care of controlling the BTS (starting and stopping it), but does not define the location of the BTS. This is useful when an operating system (or EFI code) is in charge of allocating space for the BTS.
When ”Use SourcePoint settings” is selected, SourcePoint not only takes care of controlling the BTS, but also creates the BTS.
Note: The BTS is actually one component of a larger memory structure called the Debug Store.
The Base address field specifies the linear base address of the Debug Store. This field is enabled when Use SourcePoint settings is enabled.
The Length field specifies the length of the Debug Store. This field is enabled when Use SourcePoint settings is enabled. The actual size of the BTS is the length of the Data Store minus 0x60 bytes.
Debug Store Format section
When Auto-detect is selected, SourcePoint will attempt to automatically determine the debug store format. This works in 99% of the cases. If the Trace view is not displaying correct disassembly try forcing this setting to either 32-bit (12 byte BTMs), or 64-bit (24 byte BTMS)
Trace Capture Mode section
When ”overwrite” is selected, SourcePoint clears the BTS prior to each data capture. When ”append” is selected, new trace data is appended to existing trace data. The default setting is overwrite.
AET Trace tab
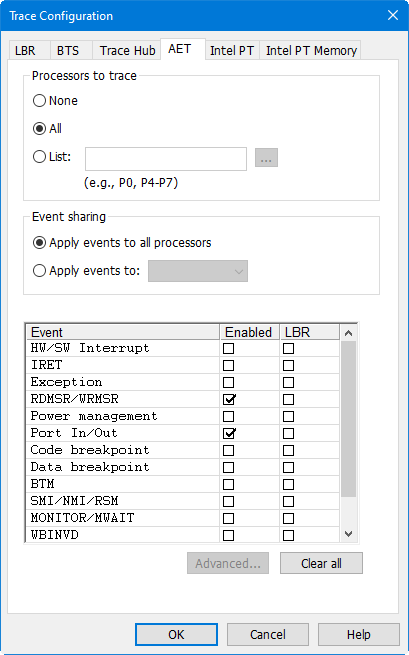
AET Configuration Tab
Processors to trace section
These controls specify which processors will be traced.
None. Disables Event trace.
All. Enables Event tracing on all processors.
List. Enables Event processor tracing on selected processors. Use commas to list processors (e.g., P2, P4, P6). Use a hyphen to specify a range of processors (e.g., P0-P4). Press the Browse button to the right to graphically specify processors.
Note: If AET is routed through the trace hub, then the trace hub must be enabled in the Trace_Hub Configuration tab.
Event sharing section
These controls specify whether all tracing processors will trace the same events, or whether each processor is tracing it’s own events.
When ”Apply events to all processors is selected”, the events selected in the "Processors to trace" group box will be traced on all processors.
When ”Apply events to” is selected, each tracing processor has it’s own set of events. The drop down list to the right is used to select a processor. You must select each individual processor, and then select the events you want to trace for that processor
Events to trace section
The list of events varies by processor type. Not all of these events will be available. Each event has an Enabled check box for enabling recording of that event type, and an LBR checkbox. The LBR checkbox controls whether the LBR stack is recorded with each event. This allows for the display of instruction trace leading up to the event.
HW/SW interrupt. Trace hardware and software interrupts, and also trace STI and CLI instructions. The disassembled instruction where the interrupt occurred, and the vector number are displayed.
IRET. Trace IRET instructions. The disassembled instruction is displayed.
Exception. Trace all exceptions. The disassembled instruction that caused the exception, along with the vector number and the value of CR2 are displayed.
RDMSR / WRMSR. Trace all MSR reads and writes. The MSR register number and value are displayed.
Power Management. Trace power state changes.
Port In / Out. Trace all I/O reads and writes. The I/O port number and data value are displayed.
Code breakpoint. Trace code accesses that match hardware (processor) breakpoints in the Breakpoint view.
Note: When this event is enabled, all hardware breakpoints work in conjunction with Event trace, and no longer behave as regular breakpoints.
Data breakpoint. Trace data accesses that match hardware (processor) breakpoints in the Breakpoint view.
Note: When this event is enabled, all hardware breakpoints work in conjunction with Event trace, and no longer behave as regular breakpoints.
BTM. Trace BTM events. This allows for full disassembly of all instructions. Because of the overhead associated with emitting the event data, this can slow execution down quite a bit. BTS trace is a much more efficient way for tracing instructions.
It is also possible to only trace BTM events for a specific range of code. To specify this range, press the Advanced button, and specify the range. See Advanced Configuration below.
Note: If BTS trace or Intel PT is enabled, then they take precedence over BTM event trace, and no BTM events will occur. LBR tracing is not allowed on BTM events.
SMI / NMI / RSM. Trace all SMI, NMI, RSM, INIT and SIPI (Startup IPI) events. The disassembled instruction last executed before the event occurred is shown. For SIPI events, the SIPI vector is also shown.
MONITOR / MWAIT. Trace all MONITOR and MWAIT instructions. The disassembled instruction is shown. For MONITOR the value of EAX is also displayed. For MWAIT the values of EAX and ECX are also displayed.
WBINVD. Trace all WBINVD and CLFLUSH (Cache Line Flush) events. The disassembled instruction last executed before the event occurred is shown. For CLFLUSH events, the address is also shown.
SYSENTER / EXIT. Trace all SYSENTER, SYSEXIT, SYSCALL and SYSRET events. The disassembled instruction is shown. For SYSENTER events, the system call vector is also shown. For SYSEXIT events, the return values of ESP and ESP are also shown.
PCICONFIG Read / Write. Trace all PCI Configuration reads and writes. The Bus number, Device number, Function number and Register number, along with the data access value, are displayed.
Memory Trace. Trace accesses to up to three user-defined memory ranges. These ranges are defined in the Advanced configuration dialog (see below). The linear and physical addresses of the access, along with the type (read or write), are displayed.
SGX. Trace the following SGX events: EENTER (enter enclave), ERESUME (resume enclave), EEXIT (exit enclave) and AEX (asynchronous enclave exit). The disassembled instruction is displayed.
Advanced Configuration
The Event Trace Advanced dialog is opened by pressing the Advanced button. It is used to control BTM range and memory range tracing. If neither event is supported on a processor, then the button will be disabled.
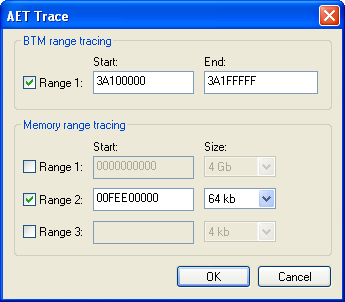
Event Trace Advanced Configuration Dialog
BTM range tracing
These controls only have an effect when the BTM checkbox in the Event Trace configuration tab is enabled.
These controls define a specific range of code to trace BTM events. The checkbox enables and disables the range. If the range is disabled, then all BTM events are traced.
The Start and End address values are linear addresses.
Memory range tracing
These controls only have an effect when the Memory Trace checkbox in the Event Trace configuration tab is enabled.
These controls define up to three specific ranges of memory accesses to trace. The checkboxes are used to enable and disable ranges.
The Start address is a physical address. It must be on a 4 kb boundary.
The Size dropdown list defines the size of the memory range to trace. The values available in the list vary based on the alignment of the Start address. For example, if the Start address is on a 16 kb boundary, then 16 kb, 8 kb and 4 kb sizes will be available. If the Start address is on a 4 kb boundary, then the only choice available will be 4 kb.
Intel PT Tab
This tab is used to configure Intel PT trace collection.
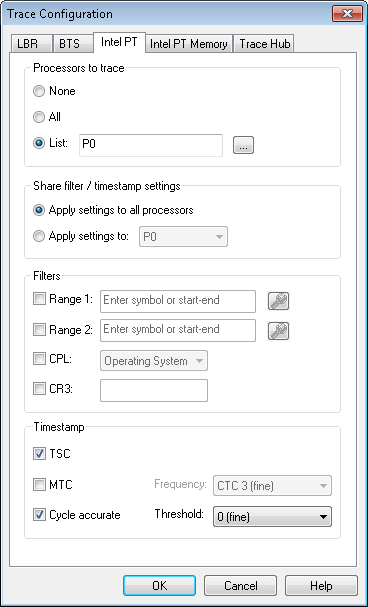
Intel PT Configuration Tab
Processors to trace section
These controls specify which processors will be traced.
None. Disables Intel PT trace.
All. Enables Intel PT tracing on all processors.
List. Enables Intel PT processor tracing on selected processors. Use commas to list processors (e.g., P2, P4, P6). Use a hyphen to specify a range of processors (e.g., P0-P4). Press the Browse button to the right to graphically specify processors.
Note: It is processor dependent whether Intel PT trace and LBR/BTS trace can be enabled at the same time. An error message will display at run time if both are enabled on a processor that does not have this capability.
Share filter / timestamp settings section
These controls specify whether all tracing processors share the same filter and timestamp settings, or whether each processor has its own settings.
When ”Apply settings to all processors” is selected, the settings selected in the Filters and Timestamp group boxes apply to all processors.
When ”Apply settings to” is selected, each tracing processor has its own filter and timestamp settings. The dropdown list to the right is used to select a processor. You must select each individual processor, and then specify the settings you want for that processor
Filters section
Intel PT can optionally be configured to trace instructions only when the CPU is executing code within certain IP ranges. If the IP is outside of these ranges, tracing is disabled.
There are two IP ranges: Range 1 and Range 2. The checkboxes are used to enable these ranges. If neither range is enabled, all instructions are traced. The edit control to the right is used to specify the IP range. It can contain a symbolic range (e.g., a function or module name), or two addresses separated with a hyphen (e.g., 1000-2000). The Symbol finder button to the right can be used to lookup symbol names. It is processor-dependent whether IP ranges are supported.
Intel PT provides the ability to specify whether tracing can occur in OS (CPL=0) or User (CPL>0) modes. The CPL checkbox enables this capability. The dropdown list to the right selects what to trace. If not enabled, then all privilege levels are traced.
Intel PT can enable or disable trace generation depending on the current CR3 value. The CR3 checkbox enables this capability. The edit control to the right specifies the CR3 value to trace.
Timestamp section
Intel PT can be configured to generate timestamp information in the trace stream. Timestamp can be used to measure time within the trace data, or to time align with other Trace views. There are three types of timestamp packets that can be enabled.
TSC. TSC (Timestamp Counter) packets contain TSC values. These are the same values read from the TSC MSR or by using the RDTSC instruction. These packets are required in order to time align with other Trace views. This allows for time alignment with Intel PT from other processors or with SW/FW trace from the Trace Hub.
MTC. MTC (Mini Time Counter) packets contain incremental updates to the CTC (a component of TSC). These values provide slightly more accuracy than TSC packets alone. The frequency of these packets is controlled with the Frequency setting. A value of CTC 6 indicates that a packet is generated whenever bit 6 of the CTC counter changes. These packets are generally not used.
Cycle Accurate. Cycle accurate packets contain information about the number of processor clocks that have occurred. These packets can be used by themselves to measure time within a trace buffer. TSC packets are required to time align with other Trace views. The frequency of these packets is controlled with the Threshold setting. This value indicates how many processor clocks occur before a packet is emitted.
Refer to the Timestamp topic in the Advanced section for more information.
Intel PT Memory Tab
The Intel PT Memory tab is used to configure the trace output region in target memory. This area contains a separate trace buffer per processor enabled for trace.
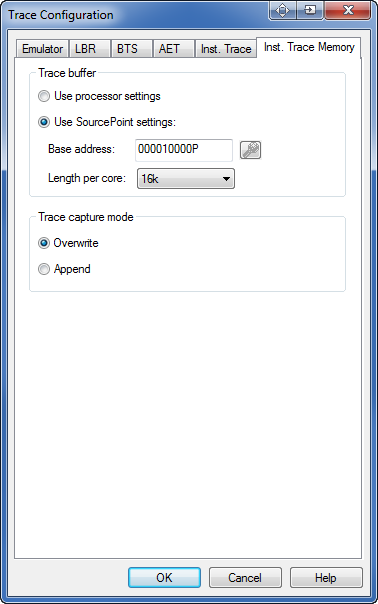
Intel PT Memory Tab
Trace Buffer section
When Use processor settings is selected, SourcePoint assumes that the location and size of the trace output region has been set by an operating system, or EFI code.
When Use SourcePoint settings is selected, SourcePoint is used to specify the location and size of the trace buffers.
The Base address field specifies the physical base address of the trace output region. The base address must be aligned with the length of the trace buffer.
The Length per core field specifies the size of the trace buffer. Sizes range from 16 kb to 128 Mb in powers of two. The actual size of the trace output region is the number of processors enabled for trace times the length per core.
Trace Capture Mode section
When overwrite is selected, SourcePoint clears the trace buffer prior to each data capture. When append is selected, new trace data is appended to existing trace data. The default setting is overwrite.
Trace Hub
This tab is used to configure the Trace Hub for system trace collection.
NOTE: The Trace Hub must be enabled in BIOS prior to use. This setting can usually be found in either the PCH section, or in the Debug section.
Software / firmware trace (system trace) is generated by software running on the target. Typically, this consists of ASCII strings, but it can also contain hex data. The Trace Hub supports multiple streams of software trace. In fact, the Trace Hub supports up to 65536 masters, each with up to 256 channels (streams of software trace), for a theoretical maximum of 16M streams of trace.
User-provided metadata is used to describe the display format of System trace. Refer to Trace Hub Metadata for more information.
If the target contains any Trace Hubs, there will be a configuration tab for each.
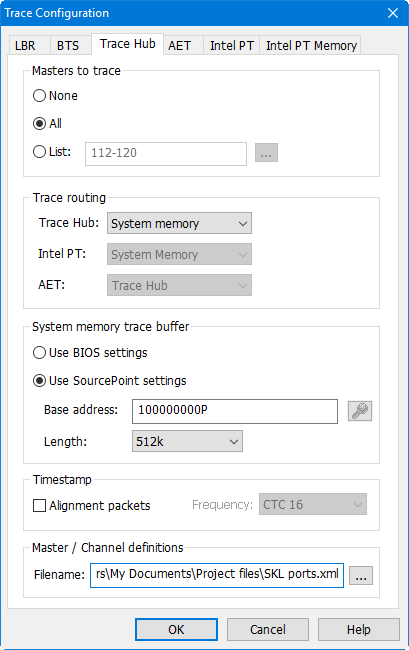
Trace Hub Configuration Tab
Masters to Trace Section
These controls specify which masters will be traced.
None. Disables Trace Hub trace.
All. Enables tracing of all masters.
List. Enables tracing of selected masters. Use commas to list individual masters (e.g., 2, 4, 6). Use a hyphen to specify a range of masters (e.g., 32-256). Press the Browse button to the right to graphically specify masters.
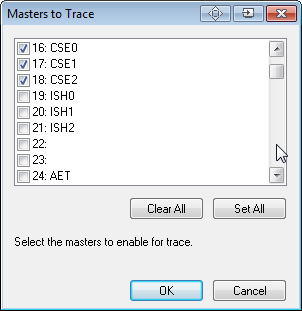
Masters to Trace dialog
This dialog displays master names rather than just the master numbers. The names come from the XML metadata file user-specified in the Master / channel definitions file.
Trace Source Routing section
These controls specify the routing of different types of trace data to different destinations.
Trace Hub. Trace Hub routing refers to Software / Firmware trace. There are currently three trace destinations: system memory, MTB and DbC. When system memory is selected, trace data is stored in memory according to the settings in the Trace Buffer section. When MTB is selected, trace data is stored in the MSU trace buffer inside the Trace Hub. The advantage of using the MTB is that trace data can be captured very early in the boot process, before system memory has been initialized. The disadvantage or using the MTB is that it’s very small (typically 2 kB), where a memory-based trace buffer can be as large as desired. The DbC selection is only available when you have a DCI connection to the target. In this case, trace data is streamed from the target and stored in an internal 512 MB trace buffer inside SourcePoint. This trace mode has the same advantages of MTB in that trace can be captured before system memory is available.
Intel PT. Intel PT can be routed through the Trace Hub intermixed with other types of trace data. Intel PT can also be routed directly to system memory without going through the Trace Hub. Currently, SourcePoint only supports the latter. All configuration for Intel PT is performed in the two Intel PT tabs.
AET. AET (Architectural Event Trace) can currently only be routed through the Trace Hub intermixed with other types of trace data. All configuration for AET is performed in the AET tab.
Trace Buffer section
When Use BIOS settings is selected, SourcePoint assumes that the location and size of the trace output region has been set by the BIOS. This is the safest setting to use since the BIOS will ensure the memory is dedicated to the Trace Hub, and will have defined a MTRR register to make it uncacheable.
When Use SourcePoint settings is selected, SourcePoint is used to specify the location and size of the trace buffer.
The Base address field specifies the physical base address of the trace output region. If Use BIOS settings is selected this field display the region allocated by the BIOS. If Use SourcePoint settings is selected this field displays the user-allocated region. The base address must be aligned on a 4 kb boundary. This region must be in uncacheable memory.
The Length field specifies the size of the trace buffer. Sizes range from 8 kb to 2 Gb in powers of two.
Timestamp section
SW/FW trace can be time aligned with other trace sources including AET and Intel PT. In order to convert SW/FW timestamp values to TSC values for alignment, timestamp alignment packets must be enabled.
Alignment packets: Enables timestamp alignment packets. This is only required when time alignment with other trace sources in other Trace views is desired. Note that this setting does not control whether SW/FW trace actually contains timestamp packets. This is controlled by user code generating the SW/FW trace data.
Frequency: Controls the frequency of the timestamp alignment packets. A value of CTC 16 indicates that whenever bit 16 of the CTC timer changes, a packet is emitted. The correct value to use is dependent on the density of the SW/FW trace. The sparser the trace, the higher this value should be set. Ideally, an alignment packet should be present every few thousand bytes of SW/FW trace.
Refer to the Timestamp topic in the Advanced section for more information.
Master / Channel Definitions section
The Filename control is used to specify the location of the Trace Hub metadata file. This XML file contains the Master / Channel display formatting information. The button to the right can be used to browse to the file. See Trace Hub Metadata.