SourcePoint AMD Help
Table of Contents
- Using Help
- Contacting ASSET InterTech
- Introduction to SourcePoint
- SourcePoint Environment
- SourcePoint Overview
- SourcePoint Parent Window Introduction
- SourcePoint Icon Toolbar
- File Menu
- File Menu - Project Menu Item
- File Menu - Layout Menu Item
- File Menu - Program Menu Item
- File Menu - Macro Menu Item
- File Menu - Print Menu Items
- File Menu - Update Emulator Flash Menu Item
- File Menu - Program Target Device Menu Item
- File Menu - Other Menu Items
- Edit Menu
- View Menu
- Processor Menu
- Options Menu
- Options Menu - Preferences Menu Item
- Options Menu - Target Configuration Menu Item
- Options Menu - Load Target Configuration File Menu Item
- Options Menu - Save Target Configuration File Menu Item
- Options Menu - Emulator Configuration Menu Item
- Options Menu - Emulator Connection Menu Item
- Options Menu - Emulator Reset Menu Item
- Options Menu - Confidence Tests Menu Item
- Window Menu
- Help Menu
- How To -- SourcePoint Environment
- Add Emulator Connections
- Configure Custom Macro Icons
- Configure Autoloading Macros
- Display Text on the Icon Toolbar
- Edit Icon Groups to Customize Your Toolbars
- Modify a Defined Memory Region
- Refresh SourcePoint Windows
- Save a Program
- Start SourcePoint With Command Line Arguments
- Use the New Project Wizard
- Verify Emulator Network Connections
- SourcePoint Overview
- Breakpoints Window
- Breakpoints Window Overview
- How To - Breakpoints
- Code Window
- Command Window
- Command Window Overview
- Confidence Tests Window
- Confidence Tests Window Overview
- Descriptors Tables Window
- Descriptors Tables Window Overview
- How To - Descriptors
- Devices Window
- Devices Window Overview
- How To - Devices Window
- Log Window
- Log Window Overview
- Memory Window
- Memory Window Overview
- How To - Memory Window
- Page Translation Window
- Page Translation Windows Overview
- PCI Devices Window
- PCI Devices Window Overview
- How To - PCI Devices Window
- Registers Window
- Registers Window Overview
- How To - Registers
- Symbols Windows
- Symbols Window Overview
- How To - Symbols Window
- Viewpoint Window
- Viewpoint Window Overview
- Watch Window
- Watch Window Overview
- How To - Watch Window
- Technical Notes
- SourcePoint Command Language
- Overview
- Commands and Control Variables
- aadump
- abort
- abs
- acos
- advanced
- asin
- asm
- asmmode
- atan
- atan2
- autoconfigure
- base
- bell (beep)
- bits
- break
- breakall
- cachememory
- cause
- Character Functions
- clock
- continue
- cos
- cpubreak commands
- cpuid_eax
- cpuid_ebx
- cpuid_ecx
- cpuid_edx
- createprocess
- ctime
- cwd
- dbgbreak commands
- defaultpath
- #define
- define
- definemacro
- deviceconfigure
- devicescan
- disconnect
- displayflag
- do while
- dos
- dport
- drscan
- edit
- editor
- emulatorstate
- encrypt
- error
- eval
- evalprogramsymbol
- execution point ($)
- exit
- exp
- fc
- fclose
- feof
- fgetc
- fgets
- first_jtag_device
- flist
- flush
- fopen
- for
- forward
- fprintf
- fputc
- fputs
- fread
- fseek
- ftell
- fwrite
- getc
- getchar
- getnearestprogramsymbol
- getprogramsymboladdress
- gets
- globalsourcepath
- go
- halt
- help
- homepath
- idcode
- if
- include
- invd
- irscan
- isdebugsymbol
- isem64t
- isprogramsymbol
- isrunning
- issleeping
- issmm
- jtagchain
- jtagconfigure
- jtagdeviceadd
- jtagdeviceclear
- jtagdevices
- jtagscan
- jtagtest
- keys
- last
- last_jtag_device
- left
- license
- linear
- list, nolist
- load
- loadbreakpoints
- loadlayout
- loadproject
- loadtarget
- loadwatches
- log, nolog
- log10
- loge
- logmessage
- macropath
- Memory Access
- messagebox
- mid
- msgclose
- msgdata
- msgdelete
- msgdr
- msgdump
- msgir
- msgopen
- msgreturndatasize
- msgscan
- msr
- num_activeprocessors
- num_all_devices
- num_devices
- num_jtag_chains
- num_jtag_devices
- num_processors
- pause
- physical
- port
- pow
- print cycles
- printf
- proc
- processorcontrol
- processorfamily
- processormode
- processors
- processortype
- projectpath
- putchar
- puts
- rand
- readsetting
- reconnect
- Register Access
- reload
- reloadproject
- remove
- reset
- restart
- return
- right
- runcontroltype
- safemode
- save
- savebreakpoints
- savelayout
- savewatches
- selectdirectory
- selectfile
- shell
- show
- sin
- sizeof
- sleep
- softbreak, softremove, softdisable, softenable
- sprintf
- sqrt
- srand
- step
- stop
- strcat
- strchr
- strcmp
- strcpy
- _strdate
- string [ ] (index into string)
- strlen
- _strlwr
- strncat
- strncmp
- strncpy
- strpos
- strstr
- _strtime
- strtod
- strtol
- strtoul
- _strupr
- swbreak
- switch
- swremove
- tabs
- tan
- tapdatashift
- tapstateset
- targpower
- targstatus
- taskattach
- taskbreak, taskremove, taskdisable, taskenable
- taskend
- taskgetpid
- taskstart
- tck
- time
- #undef
- unload
- unloadproject
- upload
- unlock
- use
- verify
- verifydeviceconfiguration
- verifyjtagconfiguration
- version
- viewpoint
- vpalias
- wait
- wbinvd
- while
- windowrefresh
- wport
- writesetting
- yield
- yieldflag
Code Window Introduction
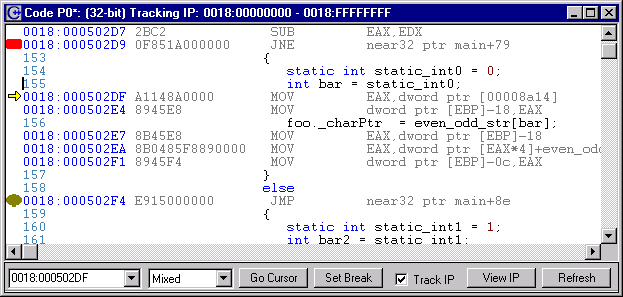
Select View|Code on the menu bar or click on the Code icon on the icon toolbar to access the Code window. The Code window is used to view code at specific addresses, run the processor, and track program execution. Various functions include setting and viewing breakpoints, viewing Disassembly, Mixed, and Source modes, and viewing existing data values in registers and memory locations. Multiple Code windows can be open simultaneously.

Code window
Note: You can cursor to addresses before the IP only if source code and/or symbols are loaded.
Display Columns
The Code window has four line-oriented display fields: Address, Object Code, Mnemonic, and Operand.
Address. The Address field contains the code segment (CS) selector and the code segment offset (EIP) for each instruction's address.
Object Code. The Object Code field contains the instruction's object code as read from memory. This field is toggled on and off using the Code Bytes menu item from Code|Display|Code Bytes on the menu bar.
Mnemonic. The Mnemonic field contains the instruction mnemonic as disassembled from memory.
Operand. The Operand field contains the operands involved in the instruction.
Dialog Bar
Address text box. In the lower left-hand corner of the window, any valid code address can be entered to disassemble that location in memory.
Code View drop down list box. In the box to the right of the Address text box is the Code View drop down list box. Choices are Disassembly, Mixed, and Source. Disassembly simply reads memory and displays the opcodes and data as mnemonics and operands. A Mixed selection displays a mixed source code/memory disassembly. A Source selection displays the source code only.
Go cursor button. This function sets a temporary breakpoint at the cursor location in the Code window and starts a processor.
Set/Clear Break button. This button sets or clears the execution breakpoint at the cursor location in the Code window.
Track IP check box. If Track IP is checked, the Code window always displays code at the processor instruction pointer (IP). If the processor stops beyond the address range currently visible in the Code window, the Code window is redrawn showing the code at the new IP. If Track IP is not enabled, the Code window retains its contents and address range, and a new Code window is opened when the processor stops if no other Code window with Track IP enabled is already opened. In effect, if Track IP is enabled, the window always shows a range of code that includes the IP. If it is disabled, you can step through code until the IP is not in the range of code visible to the Code window without the display changing to the new IP location.
View IP button. This button displays the code at the current instruction pointer location.
Refresh button. Click on the Refresh button to update the Code window by re-reading from target memory the instructions in the current address range. This menu item is useful when code resides in RAM and may be subject to change.
Finding Source Code
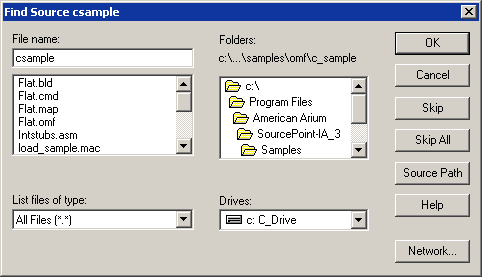
If SourcePoint cannot find your source code, a Find Source dialog box displays that lets you point SourcePoint to your source code.

Find Source dialog box

