
In the last couple of articles in this series, I’ve focused on basic run-control debugging used in conjunction with Intel Processor Trace (Intel PT). In this installment, we’ll start looking at the use of Architectural Event Trace (AET) to explore the Windows hypervisor, and how MSR accesses in particular are handled.
In the design of any hypervisor, performance and stability are extremely important: we want the Guest VM to handle as much of the workload as possible, and avoid unnecessary, expensive VM Exits. At the same time, Guest access to privileged instructions is restricted in the interest of security and isolation of the Guest.
As per the Intel SDM, Section 26.1.2, the following instructions unconditionally cause VM exits when they are executed in VMX non-root operation (that is, by the Guest):
CPUID, GETSEC, INVD, and XSETBV. This is also true of instructions introduced with VMX, which include: INVEPT, INVVPID, VMCALL, VMCLEAR, VMLAUNCH, VMPTRLD, VMPTRST, VMRESUME, VMXOFF, and VMXON.
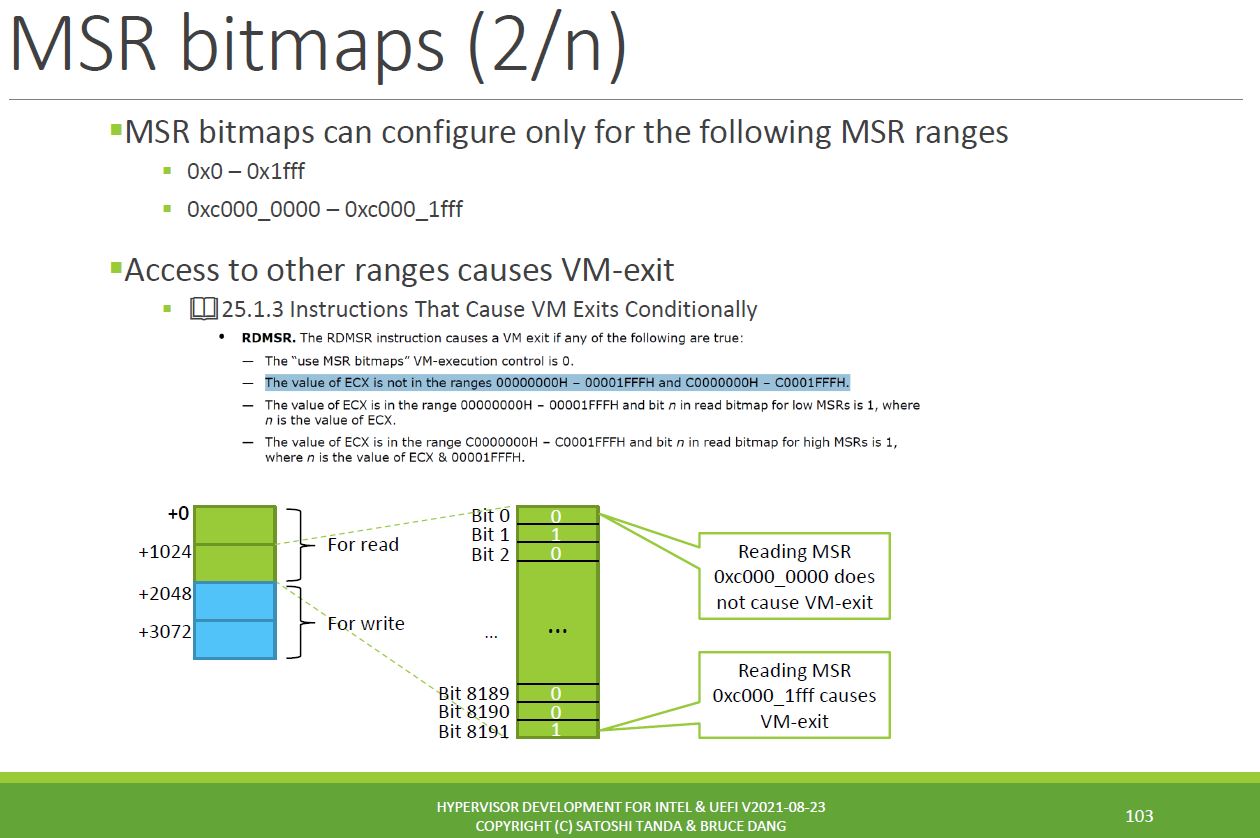
And Section 26.1.3 contains a list of instructions that cause VM Exits conditionally. It’s a long list, and today we’ll focus on the RDMSR and WRMSR (Read MSR and Write MSR) instructions. As an excerpt out of Section 26.1.3:
RDMSR. The RDMSR instruction causes a VM exit if any of the following are true:
— The “use MSR bitmaps” VM-execution control is 0.
— The value of ECX is not in the ranges 00000000H – 00001FFFH and C0000000H – C0001FFFH.
— The value of ECX is in the range 00000000H – 00001FFFH and bit n in read bitmap for low MSRs is 1, where n is the value of ECX.
— The value of ECX is in the range C0000000H – C0001FFFH and bit n in read bitmap for high MSRs is 1, where n is the value of ECX & 00001FFFH.
Note: for a RDMSR, ECX contains the address of the MSR that is to be read from. The 64-bit output goes into the EDX and EAX registers, often written as EDX:EAX.
And the corresponding information for WRMSR is symmetrical.
This makes a fascinating topic for learning using SourcePoint WinDbg, as (1) we do have access to the VM-execution control information from within the VMCS, and (2) Intel AET can capture all RDMSR and WRMSR instructions as events (without halting the target), giving insight into values that are being read from or written to what MSRs, in what code context.
Firstly, let’s understand more about RDMSR and WRMSR instructions in a hypervisor context, and “MSR bitmaps”. For MSR reads and writes, it would certainly be possible to create a hypervisor that would trap every Guest invocation of these instructions, and let them be handled by the hypervisor. And this is indeed the default. But this would be inefficient and unstable. We want to avoid unnecessary VM Exits due to MSR accesses. This is accomplished with the use of the aforementioned MSR bitmaps. The following two slides, taken from Satoshi Tanda’s hypervisor course (thanks again, Satoshi, great course!) summarize how these bitmaps work:
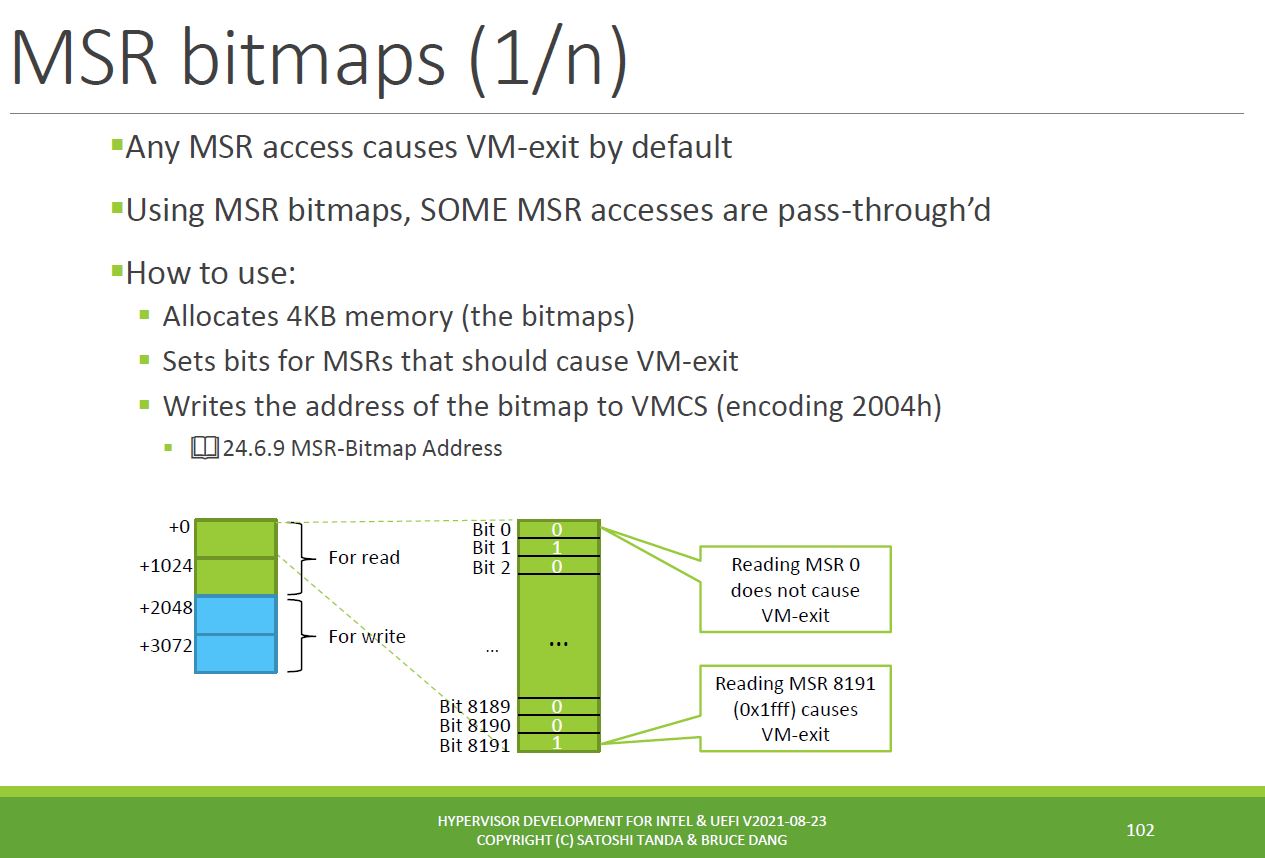
Maybe this clarifies it a little:
- The MSR bitmap is allocated 4kB of memory.
- 2kB each is associated with MSR Reads and Writes.
- For RDMSR, 1kB (8,192 bits) is allocated to MSR’s 0000 – 1FFF (and of course 0x1FFF = decimal 8,191).
The charts above present visually what the SDM is saying. You can look at the individual bits in the bitmaps to understand whether reading or writing a particular MSR will cause a trap or not. For a given MSR, if the bitmap bit is ‘0’, there won’t be a VM Exit. If it is ‘1’, reading or writing that MSR will cause a VM Exit. We’ll see what that looks like below with SourcePoint WinDbg.
Secondly, it’s worthwhile knowing a little more about AET before proceeding. In my opinion, AET is one of the best debug utilities on Intel platforms, in fact on any platform. Intel Processor Trace is great for watching code flow, but AET truly complements it by showing the other side of the coin: what events are happening on the platform. Both traces are timestamped, and when used together (it can be challenging, as you can read in my blog here: WinDbg with correlated timestamps for Event and Instruction Trace) tremendous insight into the Windows internals is possible. For more information on AET, check out my article Intel Architectural Event Trace (AET) in action, or for a longer, more detailed treatment, watch the webinar I did with the UEFI Forum here: https://www.youtube.com/watch?v=pHSvcO0ogdc.
AET can only be activated by placing the target into probe mode. That is, JTAG is a pre-requisite to using AET. Thus, an EXDI connection to a JTAG-based debugger, such as SourcePoint WinDbg, is the only mechanism to do x86 architectural low-level event tracing within Windows.
Given those, let’s jump in again! The other blogs in this series make for good background reading:
Part 1: VMM Breakpoint support
Part 2: The Secure Kernel with Symbols
Part 3: LBR and Intel PT in the Secure Kernel
Part 4: The VMCS, and altering it to enable Intel PT
With that background, you’ll know that we can easily break into the hypervisor itself, hvix64, as well as the hvloader, securekernel (VTL1) and NTOS Guest (VTL 0). To show how easy it is to inspect the Windows internals, we halt the target using JTAG, and use our dump macro to dump selected VMCS fields while in Host mode:
Guest-state:
  RIP: FFFFF80749C64D70
  CR3: 0000000004600000
  IA32_DEBUG_CTL: 0000000000000000
  IA32_RTIT_CTL: 0000000000000000
  IA32_LBR_CTL: FFFFF80741F0A000
Host-state:
  Exception bitmap: 00060002
  I/O bitmap (0000-7fff) address: 0000000101403000
  I/O bitmap (8000-ffff) address: 0000000101404000
  MSR bitmap address: 000000010DC4D000
  EPT pointer: 00000001102F701E
  VPID: 0002
VM-execution:
  Pin-based: 0000003F
    B0: External-interrupt exiting: TRUE
  Processor-based primary: B6A06DFA
    B23: Move DR causes VM-exit: TRUE
    B24: Unconditional I/O exiting: FALSE
    B25: Use I/O bitmaps: TRUE
    B27: Monitor trap flag: FALSE
    B28: Use MSR bitmaps: TRUE
  Processor-based secondary: 001813AB
    B01: EPT enabled: TRUE
    B05: VPID enabled: TRUE
    B14: VMCS Shadowing: FALSE
    B19: Hide NR bit in Intel PT PIPs: TRUE
    B24: Intel PT uses Guest physical: FALSE
VM-entry:
  Primary: 000213FF
    B02: Load IA32_DEBUGCTL: TRUE
    B17: Conceal VM-entry from Intel PT: TRUE
    B18: Load IA32_RTIT_CTL: FALSE
    B21: Load Guest IA32_LBR_CTL: FALSE
  MSR load count: 00000000
VM-exit:
  Primary: 0103EFFF
    B02: Save IA32_DEBUGCTL: TRUE
    B24: Conceal VM-exit from Intel PT: TRUE
    B25: Clear IA32_RTIT_CTL: FALSE
    B26: Clear IA32_LBR_CTL: FALSE
  Secondary: 41F0A000
  MSR store count: 00000000
  MSR load count: 00000000
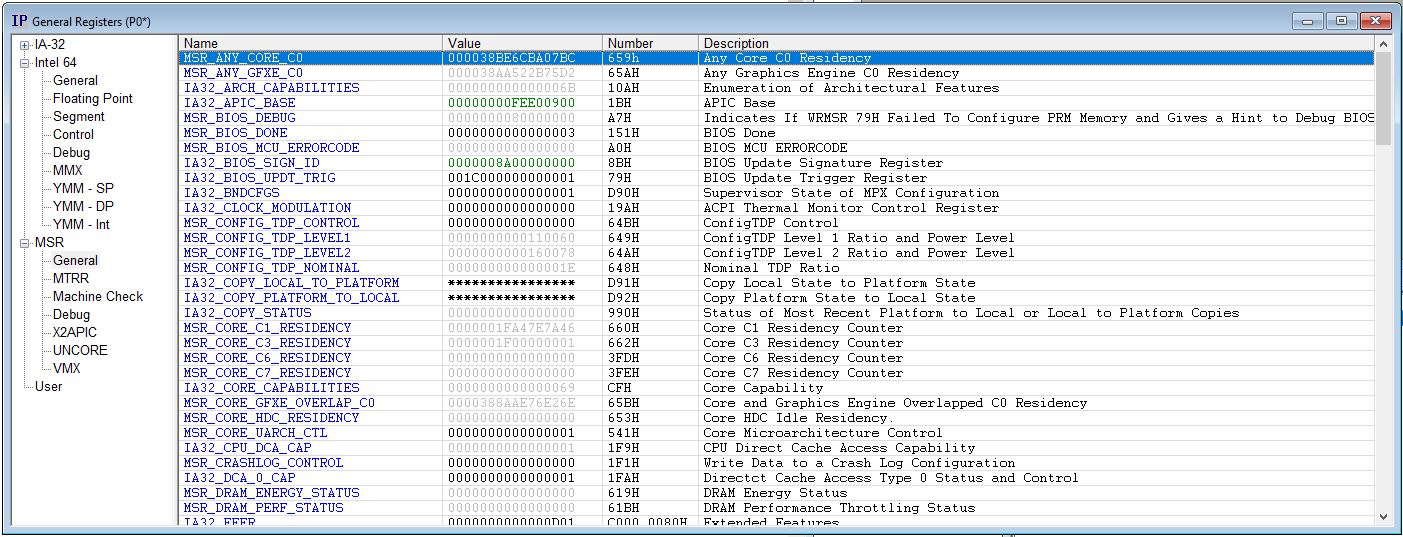
Note to interested readers: as this is currently beta software, we’re using a somewhat primitive method to dump the VMCS fields. The intent, for our next release, is to have the VMCS show up in our “Registers” window, making it much easier to view, understand and edit. An example of our Registers window is below:
There’s lots to unpack in the VMCS dump, but the highlighted portions above show us that we do have MSR bitmaps enabled on this platform (that makes a lot of sense! Microsoft, I presume, has carefully chosen and enabled the MSRs that will and will not cause a VM Exit). And, the physical address of the MSR bitmap is at 0x10DC4D000.
So, let’s use the Memory window to dump the MSR bitmap:
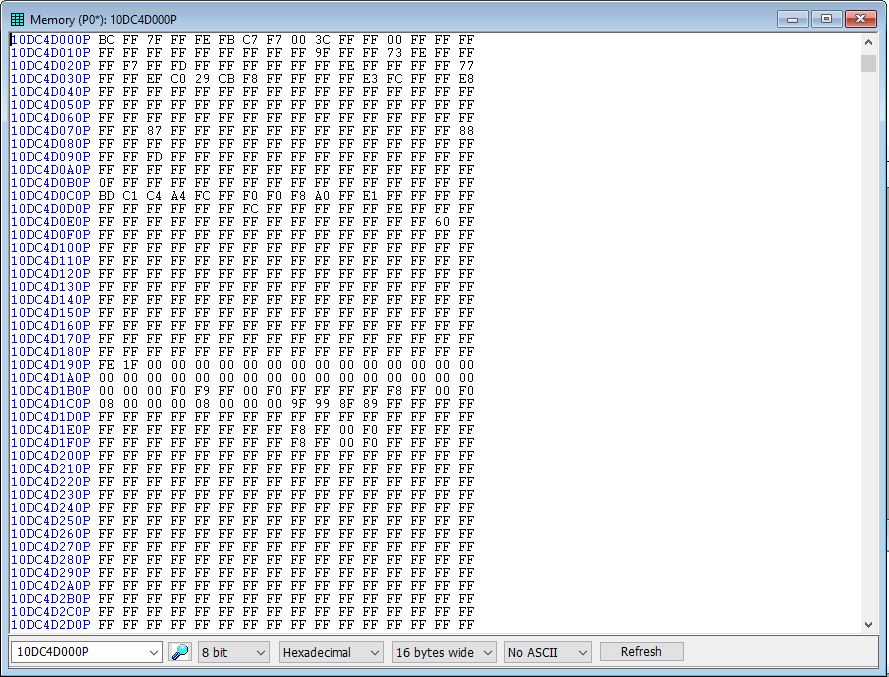
Most of the bitmap is FF, which means that most of the attempted MSR reads by the Guest will cause a trap to the hypervisor. But, you see, not all: let’s look at the base address of the bitmap, 0x10DC4D000, as an example, with the first 24 MSRs being governed by BC FF 7F, yielding:
MSR                 Description                       Bitmap Value  Will cause VM Exit?
MSR 0H (0)          IA32_P5_MC_ADDR (P5_MC_ADDR)      0             Won’t exit
MSR 1H (1)          IA32_P5_MC_TYPE (P5_MC_TYPE)      0             Won’t exit
MSR 6H (6)          IA32_MONITOR_FILTER_SIZE          0             Won’t exit
MSR 10H (16)        IA32_TIME_STAMP_COUNTER (TSC)     1             Will exit
MSR 17H (23)        IA32_PLATFORM_ID                  1             Will exit
A Guest would presumably not need to read IA32_PLATFORM_ID, so it makes sense that traps.
And in terms of the IA32_TIME_STAMP_COUNTER, this is virtualized by the hypervisor, and the SDM in Section 26.3, CHANGES TO INSTRUCTION BEHAVIOR IN VMX NON-ROOT OPERATION, says:
RDMSR. Section 26.1.3 identifies when executions of the RDMSR instruction cause VM exits. If such an execution causes neither a fault due to CPL > 0 nor a VM exit, the instruction’s behavior may be modified for certain values of ECX:
— If ECX contains 10H (indicating the IA32_TIME_STAMP_COUNTER MSR), the value returned by the instruction is determined by the setting of the “use TSC offsetting” VM-execution control:
- If the control is 0, RDMSR operates normally, loading EAX:EDX with the value of the IA32_TIME_STAMP_COUNTER MSR.
- If the control is 1, the value returned is determined by the setting of the “use TSC scaling” VM-execution control:
— If the control is 0, RDMSR loads EAX:EDX with the sum of the value of the IA32_TIME_STAMP_COUNTER MSR and the value of the TSC offset.
— If the control is 1, RDMSR first computes the product of the value of the IA32_TIME_STAMP_COUNTER MSR and the value of the TSC multiplier. It then shifts the value of the product right 48 bits and loads EAX:EDX with the sum of that shifted value and the value of the TSC offset.
The 1-setting of the “use TSC-offsetting” VM-execution control does not affect executions of RDMSR if ECX contains 6E0H (indicating the IA32_TSC_DEADLINE MSR). Such executions return the APIC-timer deadline relative to the actual timestamp counter without regard to the TSC offset.
Whew! This is worth some study on its own. I may one day write a light hypervisor of my own, so seeing how Hyper-V operates gives me a huge head start on my learning.