
In this article, we’ll look at some of the fields within the VMCS, and change them to combat some of the mitigations against instruction trace within Windows.
As this is Part 4 in the series, suggested reading prior to the deeper dive in this blog are:
Part 1: An introduction to debugging Windows with Hyper-V and VBS enabled, our VM Launch and VM Exit breakpoints, and a quick look at Intel Processor Trace
Part 2: Intel Processor Trace for a Guest (securekernel) to Host (hvix64) transition
Part 3: Debugging the securekernel with symbols
As an introduction, I enjoy spending my spare time exploring deeply technical topics, learning new things, and then writing about them so that others can take these learnings to the next level. Although not a cybersecurity researcher myself, I think that Satoshi Tanda said it well in his article, How I found Microsoft Hypervisor bugs as a by-product of learning, with
“Simply learning security features yielded two vulnerabilities in Windows core components (and 3000 USD) as by-product. If you are a kind of person who likes to do security feature research and still wishes to find vulnerabilities time to time, that is OK to focus on what interest you.”
So, with that said, I’m going to jump in!
To gain more insight into the operations of the Windows hypervisor and early boot, we’ve created a small SourcePoint macro that dumps some of the more important fields within a VMCS, so we can see them and change them. It’s based upon Satoshi’s hvext.js application, a WinDbg extension that implements commands helpful to study Hyper-V on Intel processors. For those who may be unfamiliar with it, SourcePoint has a self-contained command language that can be used to create macros for automation of frequently-used operations. The macro language is interpreted, very ‘C’-like, and easy to program with. Our “vmcs” macro uses inline assembly with the following functions:
vmread          // Perform vmread based on (encoding)

vmwrite         // Do a VM write with (encoding, value)

dump            // Dump interesting VMCS fields

reason          // Display VM exit reason

ipt             // Enable Intel PT tracing
As an example, a code snippet out of the “dump” function is:
x32 = vmread(4002)

   printf("  Processor-based primary: %08X\n", x32)

   printf("    B23: Move DR causes VM-exit: %B\n", (x32 & (1 << 23t)))

   printf("    B24: Unconditional I/O exiting: %B\n", (x32 & (1 << 24t)))

   printf("    B25: Use I/O bitmaps: %B\n", (x32 & (1 << 25t)))

   printf("    B27: Monitor trap flag: %B\n", (x32 & (1 << 27t)))

   printf("    B28: Use MSR bitmaps: %B\n", (x32 & (1 << 28t)))
To see “dump” in action, if you follow the steps in Part 3, and break at three consecutive VM Launch breakpoints, clear the VM Launch breakpoint, set a VM Exit breakpoint, and hit Go, you’ll land in the following modules consecutively:
hvix64 (Guest)

hvloader (Guest)

securekernel (Guest)

hvix64 (Host)
And then issue the “dump” command, you’ll see something like this:
Guest-state:

  RIP: FFFFF8052B827F94

  CR3: 0000000004600000

  IA32_DEBUG_CTL: 0000000000000000

  IA32_RTIT_CTL: 0000000000000000

  IA32_LBR_CTL: FFFFF80523A6E000

Host-state:

  Exception bitmap: 00060002

  I/O bitmap (0000-7fff) address: 0000000101403000

  I/O bitmap (8000-ffff) address: 0000000101404000

  MSR bitmap address: 000000010DC55000

  EPT pointer: 00000001102FF01E

  VPID: 0002

VM-execution:

  Pin-based: 0000003F

    B0: External-interrupt exiting: TRUE

  Processor-based primary: B6A06DFA

    B23: Move DR causes VM-exit: TRUE

    B24: Unconditional I/O exiting: FALSE

    B25: Use I/O bitmaps: TRUE

    B27: Monitor trap flag: FALSE

    B28: Use MSR bitmaps: TRUE

  Processor-based secondary: 001813AB

    B01: EPT enabled: TRUE

    B05: VPID enabled: TRUE

    B14: VMCS Shadowing: FALSE

    B19: Hide NR bit in Intel PT PIPs: TRUE

    B24: Intel PT uses Guest physical: FALSE

VM-entry:

  Primary: 000213FF

    B02: Load IA32_DEBUGCTL: TRUE

    B17: Conceal VM-entry from Intel PT: TRUE

    B18: Load IA32_RTIT_CTL: FALSE

    B21: Load Guest IA32_LBR_CTL: FALSE

  MSR load count: 00000000

VM-exit:

  Primary: 0103EFFF

    B02: Save IA32_DEBUGCTL: TRUE

    B24: Conceal VM-exit from Intel PT: TRUE

    B25: Clear IA32_RTIT_CTL: FALSE

    B26: Clear IA32_LBR_CTL: FALSE

  Secondary: 23A6E000

  MSR store count: 00000000

  MSR load count: 00000000

VM-exit information:

  Reason: 00000020
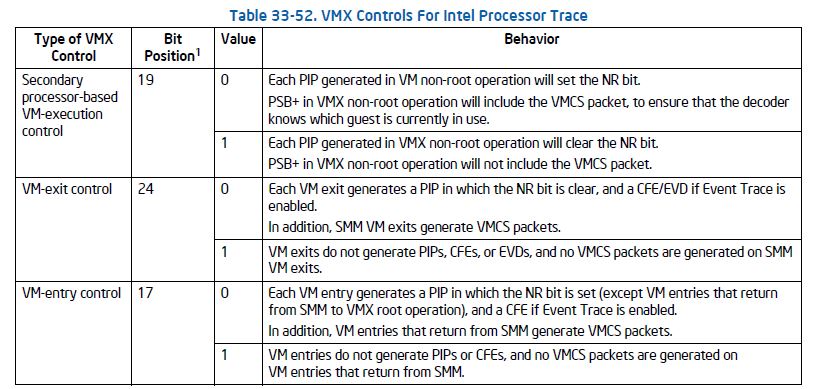
As it relates to debugging, there are a few fields we need to change. This is the purpose of the “ipt” function. We have to clear the “conceal” bits within the VMX Controls for Intel Processor Trace. These can be seen within the Intel SDM:
After running the “ipt” function, an equivalent “dump” looks like this:
Guest-state:

  RIP: FFFFF80685EB7F94

  CR3: 0000000004600000

  IA32_DEBUG_CTL: 0000000000000000

  IA32_RTIT_CTL: 0000000000000000

  IA32_LBR_CTL: FFFFF8067E14F000

Host-state:

  Exception bitmap: 00060002

  I/O bitmap (0000-7fff) address: 0000000101403000

  I/O bitmap (8000-ffff) address: 0000000101404000

  MSR bitmap address: 000000010DC55000

  EPT pointer: 00000001102FF01E

  VPID: 0002

VM-execution:

  Pin-based: 0000003F

    B0: External-interrupt exiting: TRUE

  Processor-based primary: B6A06DFA

    B23: Move DR causes VM-exit: TRUE

    B24: Unconditional I/O exiting: FALSE

    B25: Use I/O bitmaps: TRUE

    B27: Monitor trap flag: FALSE

    B28: Use MSR bitmaps: TRUE

  Processor-based secondary: 001013AB

    B01: EPT enabled: TRUE

    B05: VPID enabled: TRUE

    B14: VMCS Shadowing: FALSE

    B19: Hide NR bit in Intel PT PIPs: FALSE

    B24: Intel PT uses Guest physical: FALSE

VM-entry:

  Primary: 000013FF

    B02: Load IA32_DEBUGCTL: TRUE

    B17: Conceal VM-entry from Intel PT: FALSE

    B18: Load IA32_RTIT_CTL: FALSE

    B21: Load Guest IA32_LBR_CTL: FALSE

  MSR load count: 00000000

VM-exit:

  Primary: 0003EFFF

    B02: Save IA32_DEBUGCTL: TRUE

    B24: Conceal VM-exit from Intel PT: FALSE

    B25: Clear IA32_RTIT_CTL: FALSE

    B26: Clear IA32_LBR_CTL: FALSE

  Secondary: 7E14F000

  MSR store count: 00000000

  MSR load count: 00000000

VM-exit information:

  Reason: 00000020
You can see that bit 19 within “Secondary processor-based VM-execution control” is now cleared; same goes for bit 24 of “VM-exit control” and bit 17 of “VM-entry control”. Nice! Now, we can run Intel PT uninterrupted.
Now, if when sitting in hvix64 in Host mode, we set a VM Exit breakpoint and hit Go with Intel PT enabled, we see some of the beautiful instruction trace:
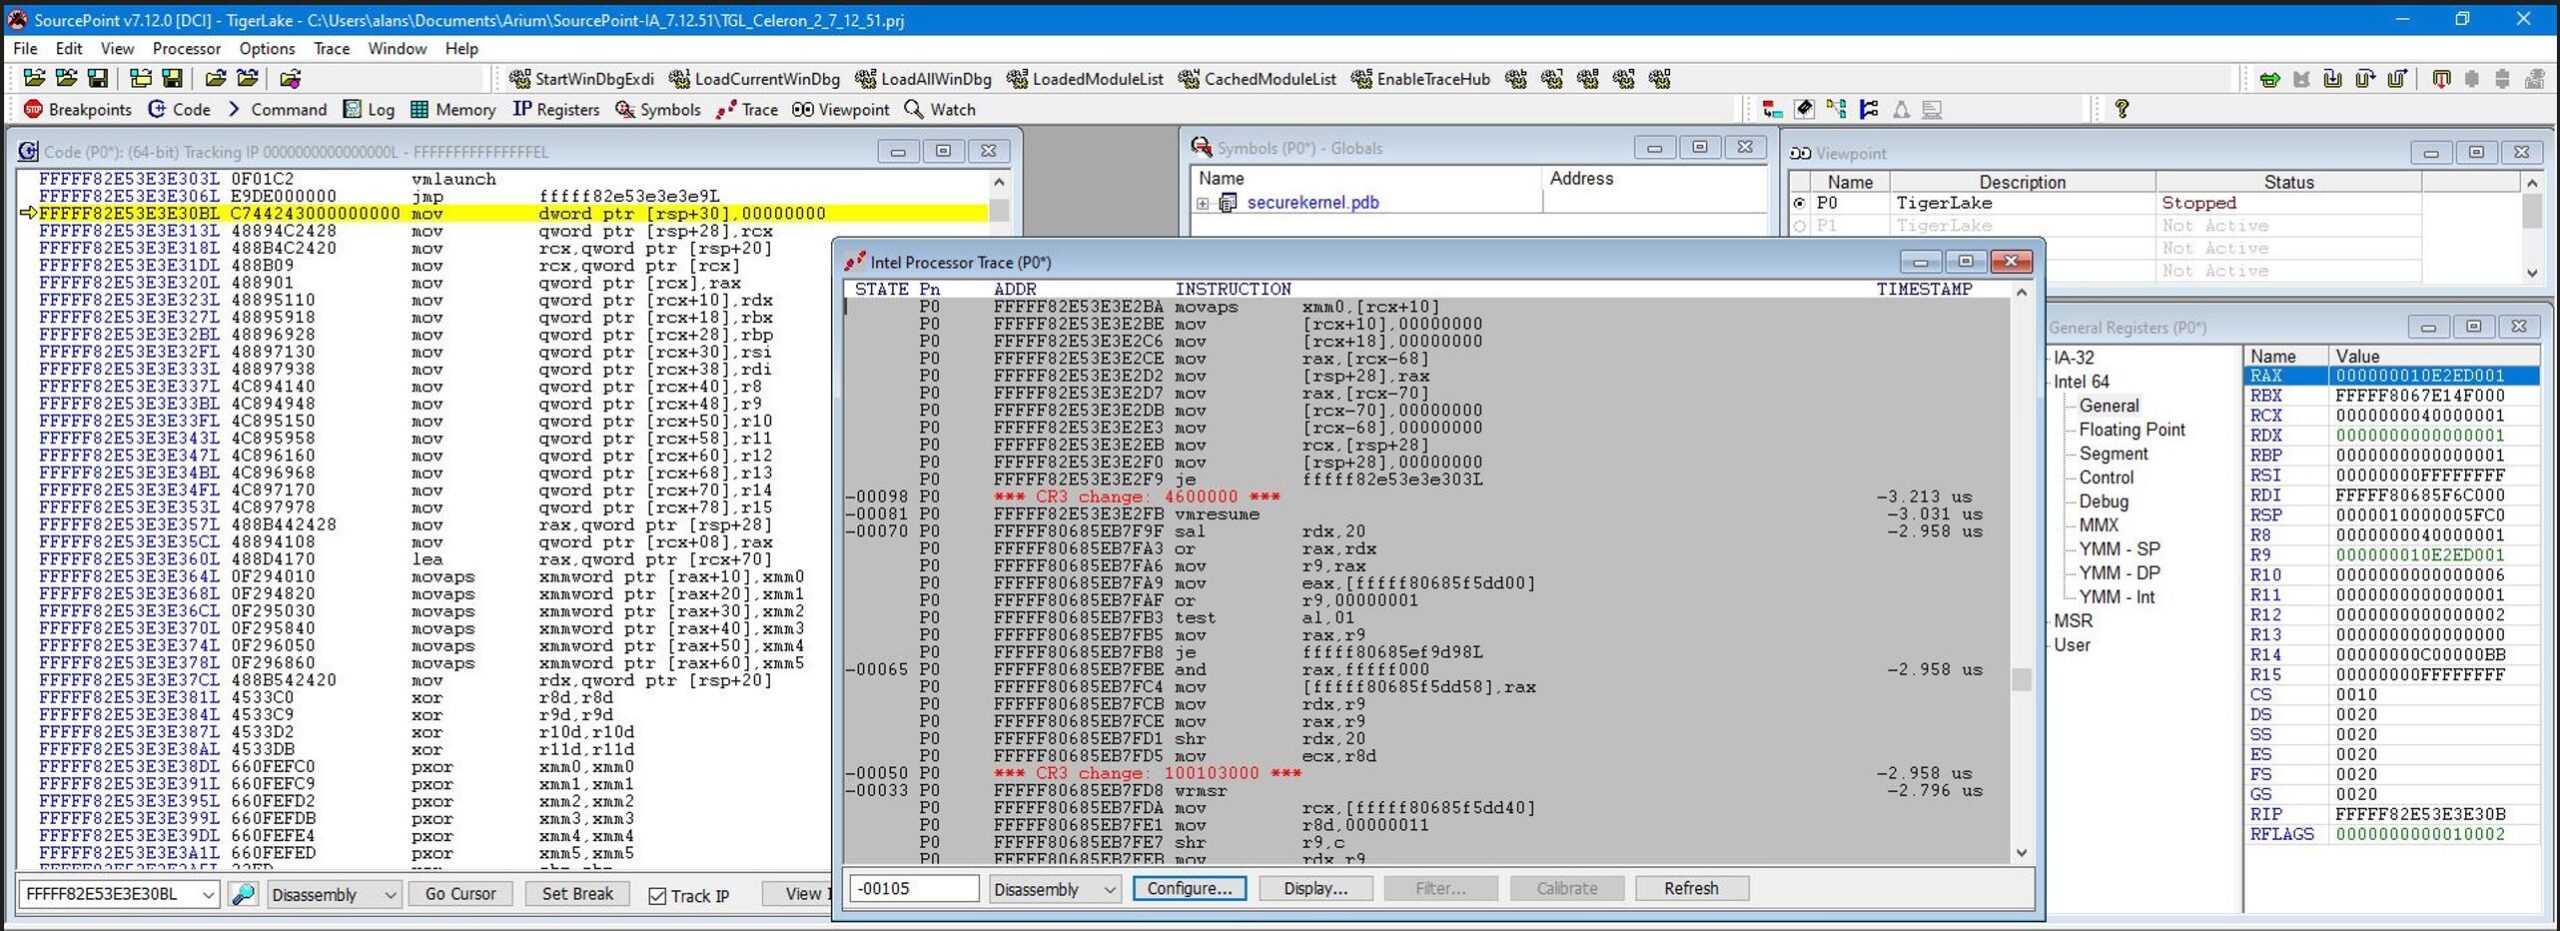
You can see some really interesting things by closely examining the Command, General Registers, Command and Intel Processor Trace windows:
Note the WRMSR leading up to the Exit. From the Intel SDM, Volume 3, Appendix C, Table C-1, VMX Basic Exit Reasons, you can see the description against this reason:
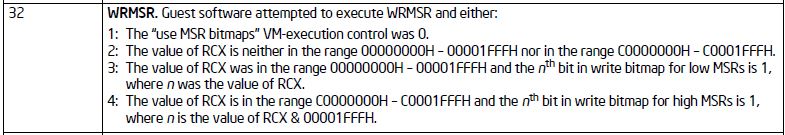
In the General Registers window, the value of RCX, which is the MSR to write to, is 0x40000001. To understand what this relates to, you need to look in the Windows Hypervisor Top Level Functional Specification (TLFS). Note from the TLFS that:
#define HV_X64_MSR_HYPERCALL 0x40000001
And a short excerpt is:
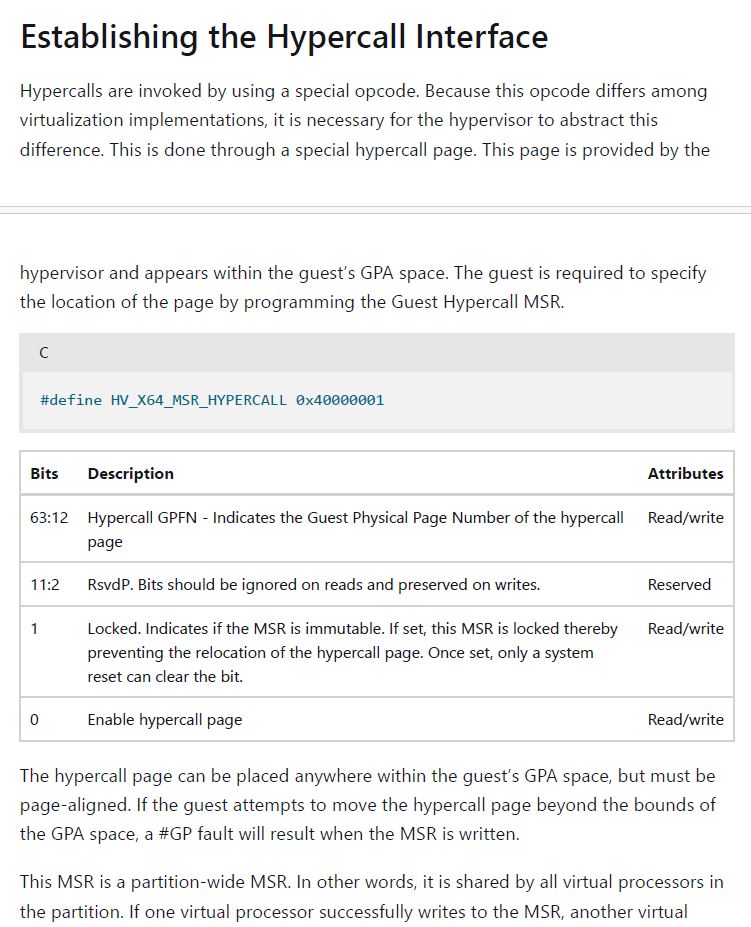
And EAX:EDX is 10E2ED001:00000001 and written to MSR 0x40000001. It’s an exercise for later to map this to the table above, but you can see that bit 0 is set to ‘1’; the hypercall page is enabled.
Note from the Intel SDM that MSR range “MSR address range between 40000000H – 4000FFFFH is marked as a specially reserved range. All existing and future processors will not implement any features using any MSR in this range”. Part of this is reserved for hypervisor technology, and can be read about in the TLFS, or in the Xen/KVM source code. Thanks to Alex for pointing this out. Last week, I spent about eight hours on planes, so I got a chance to catch up on the Intel SDM, the hypervisor TLFS, and the Virtualization chapter of the Windows Internals Part 2 book – but I haven’t gone through the Xen/KVM source code yet. 😊
Another interesting example of the hypervisor operation: you can use the SourcePoint macro language to chain commands together and see the exit reasons for consecutive VM Exits with the simple command string with our “reason” command (invoked from the vmcs macro), and the results below:
>define int i; for (i = 0; i < 10; i++) {go; wait; reason}

WRMSR (32)

RDMSR (31)

WRMSR (32)

VMCALL (18)

VMCALL (18)

VMCALL (18)

Control-register access (28)

VMCALL (18)

VMCALL (18)

VMCALL (18)
Really interesting. It’s easy enough to explore the specific code leading up to the exits to see what is going on.
One last thing: as a fun thing, I went “off the fairway”, and when I ran the above command line again, I saw the following:
RDMSR (31)

VMCALL (18)

Triple fault (2)
It’s pretty cool to see a triple fault coming out of a VMExit. And, the nice thing is that Windows recovered splendidly. How’d I do that? With JTAG, of course.