
I’m having a tremendous amount of fun learning about Windows internals with the new support of WinDbg via our SourcePoint JTAG debugger. This is a multi-part series on exploring some of the undebuggable code within the Windows hypervisor and secure kernel.
If you look within the current SourcePoint WinDbg Getting Started Guide, you see an errata section at the end with the section title, WinDbg doesn’t like debugging over EXDI with VBS Enabled. We’re in the process of fixing this, and I have some code that I’m using here that addresses it. The fix will be in the upcoming SourcePoint production release.
In the meantime, below are the steps that I followed to use the tool to explore functionality within the Windows internals that is normally not visible. I’m using the AAEON UP Xtreme i11 Tiger Lake board, equipped with Intel Direct Connect Interface (DCI) for its JTAG connection, for all of my experiments. For background, highly recommended reading is the SourcePoint WinDbg Getting Started Guide. I would also refer Andrea Allievi’s Debugging the Undebuggable – Part 1 and Connor McGarr’s Exploit Development: No Code Execution? No Problem! Living The Age of VBS, HVCI, and Kernel CFG as excellent references.
First, make sure that VBS and Hyper-V are turned on.
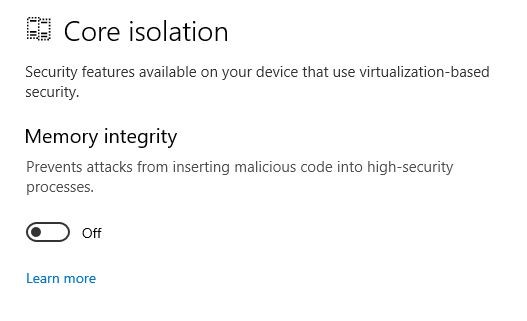
For VBS, go to Device Security > Core Isolation and turn on Memory Integrity:
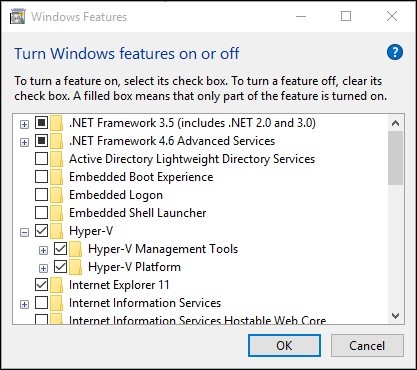
For Hyper-V, right click on the Windows button and select ‘Apps and Features’; select Programs and Features on the right under related settings; select Turn Windows Features on or off; then select Hyper-V and click OK:
With Hyper-V and VBS enabled, it is necessary to turn off the “Synthetic Watchdog” to disable the system-wide watchdog timer that kicks in when SourcePoint has used JTAG to halt the target. There’ll be more info on that forthcoming in an update to the Getting Started Guide.
For now, we’ll just use Intel Processor Trace (Intel PT) to explore the code implementing some of the Windows hypervisor technology.
Boot to the UEFI shell. For the Tiger Lake board, this is accomplished by powering on the target and holding down the F7 key until the password prompt appears.
At this point, the target memory has been initialized, but we’re still in UEFI; the target hasn’t booted into Windows yet, and there is no hypervisor active. We can set some interesting breakpoints and use trace with Intel PT to see the early stages of Windows secure boot and the code leading up to it.
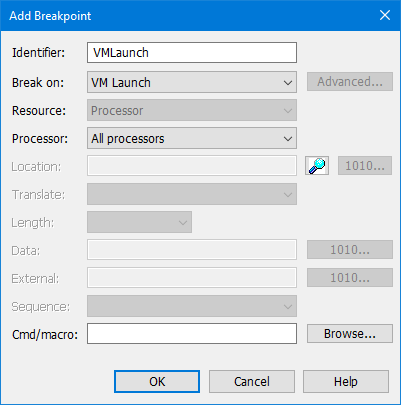
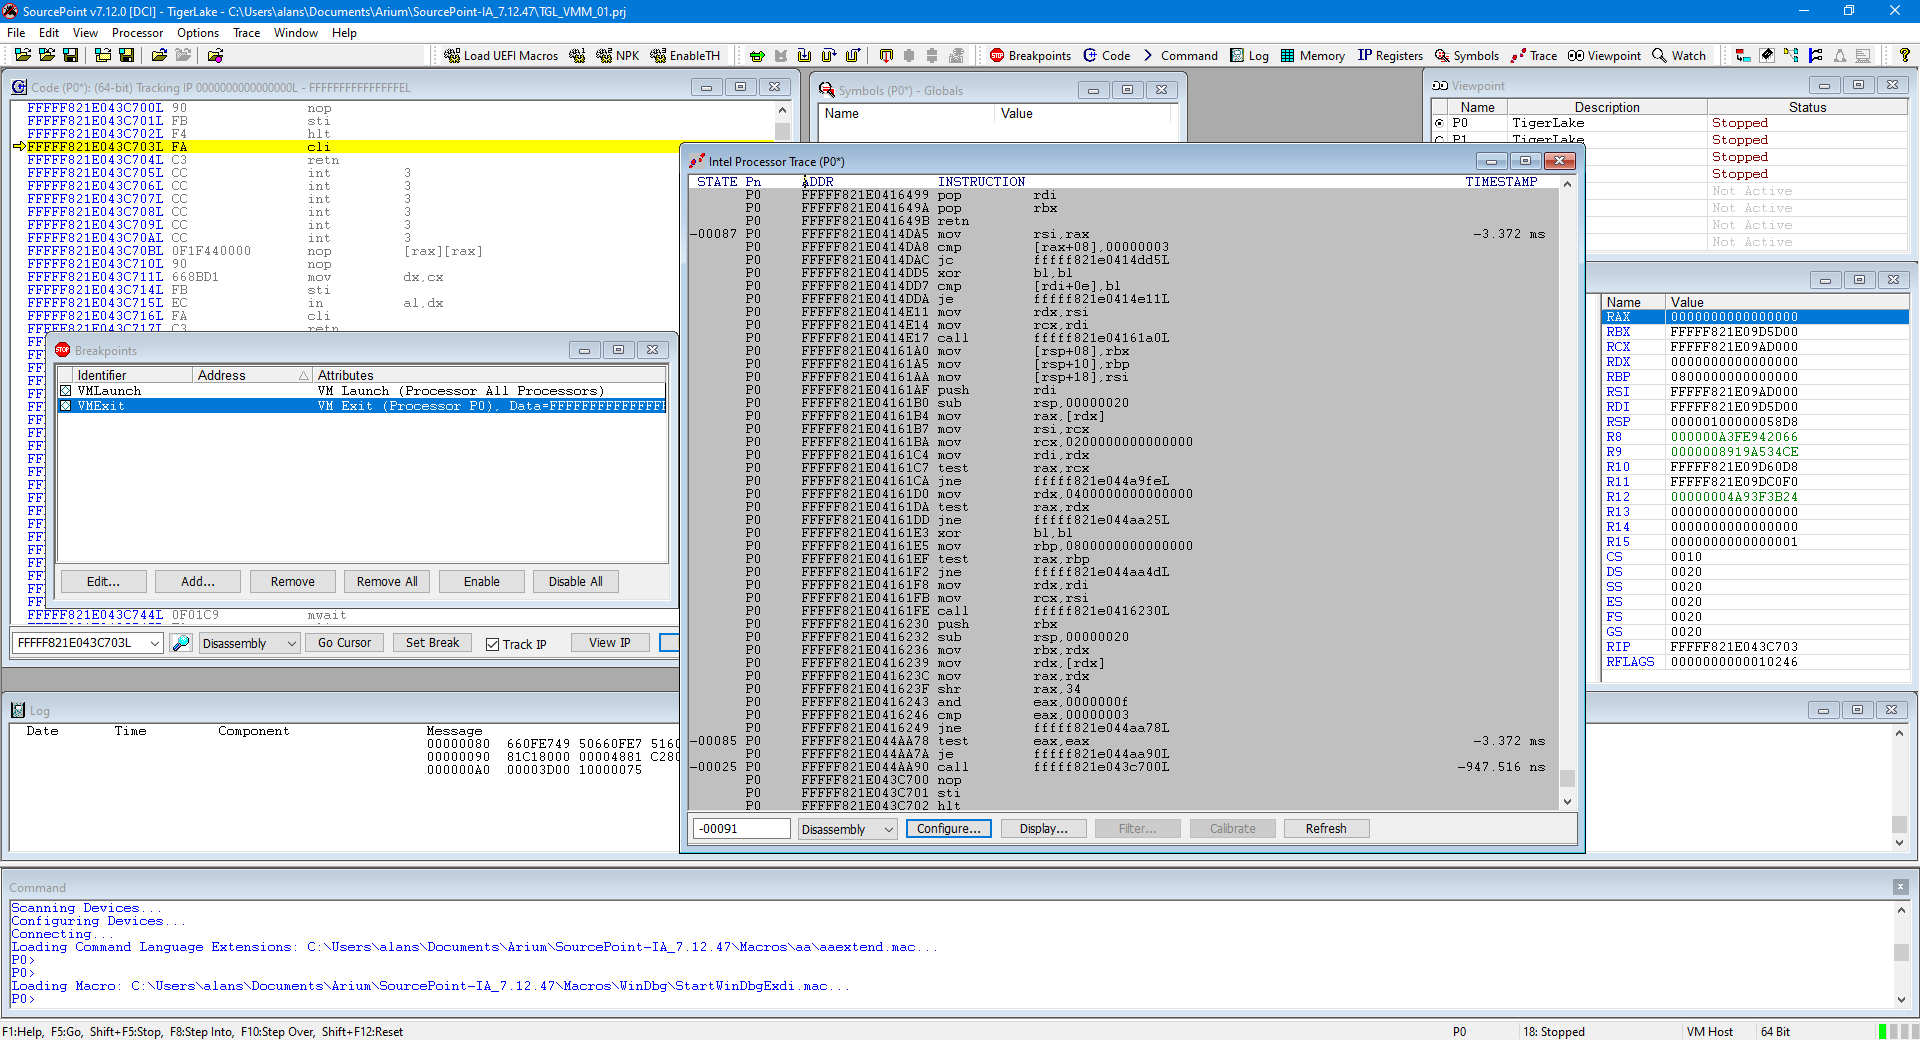
Launch SourcePoint, connect to the target, halt it, and then place VMLaunch and VMExit breakpoints, for example:
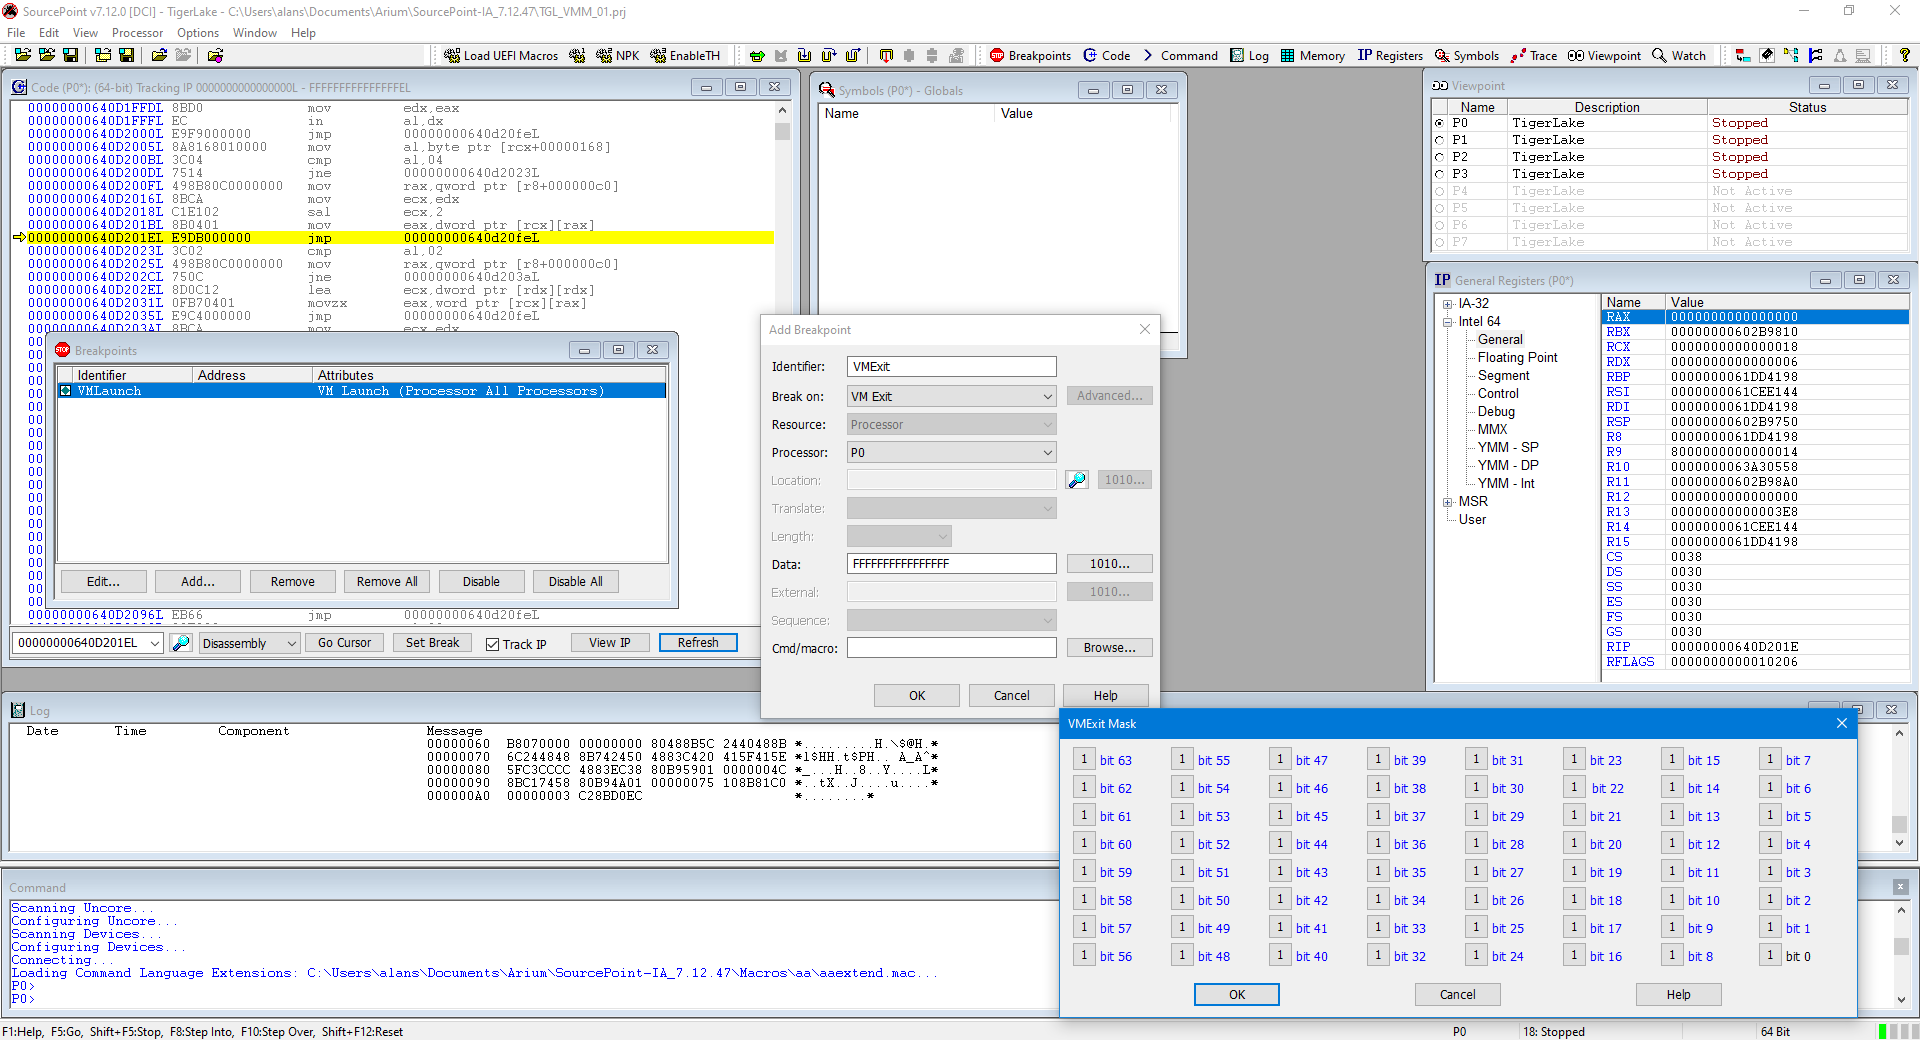
Note that the VMExit mask is all ‘F’s. That means that we’ll break on any and all Basic Exit Reasons, as defined in the Intel SDM. It is certainly possible to narrow down the exit reason to understand the specific reason that the transition from the guest OS was made; I’ll write about that in a future article.
Also turn on Intel PT. How to do this is covered in the Getting Started Guide.
Then hit SourcePoint Go. That will stop us at the first invocation of the hypervisor breakpoints, very early in the boot process:
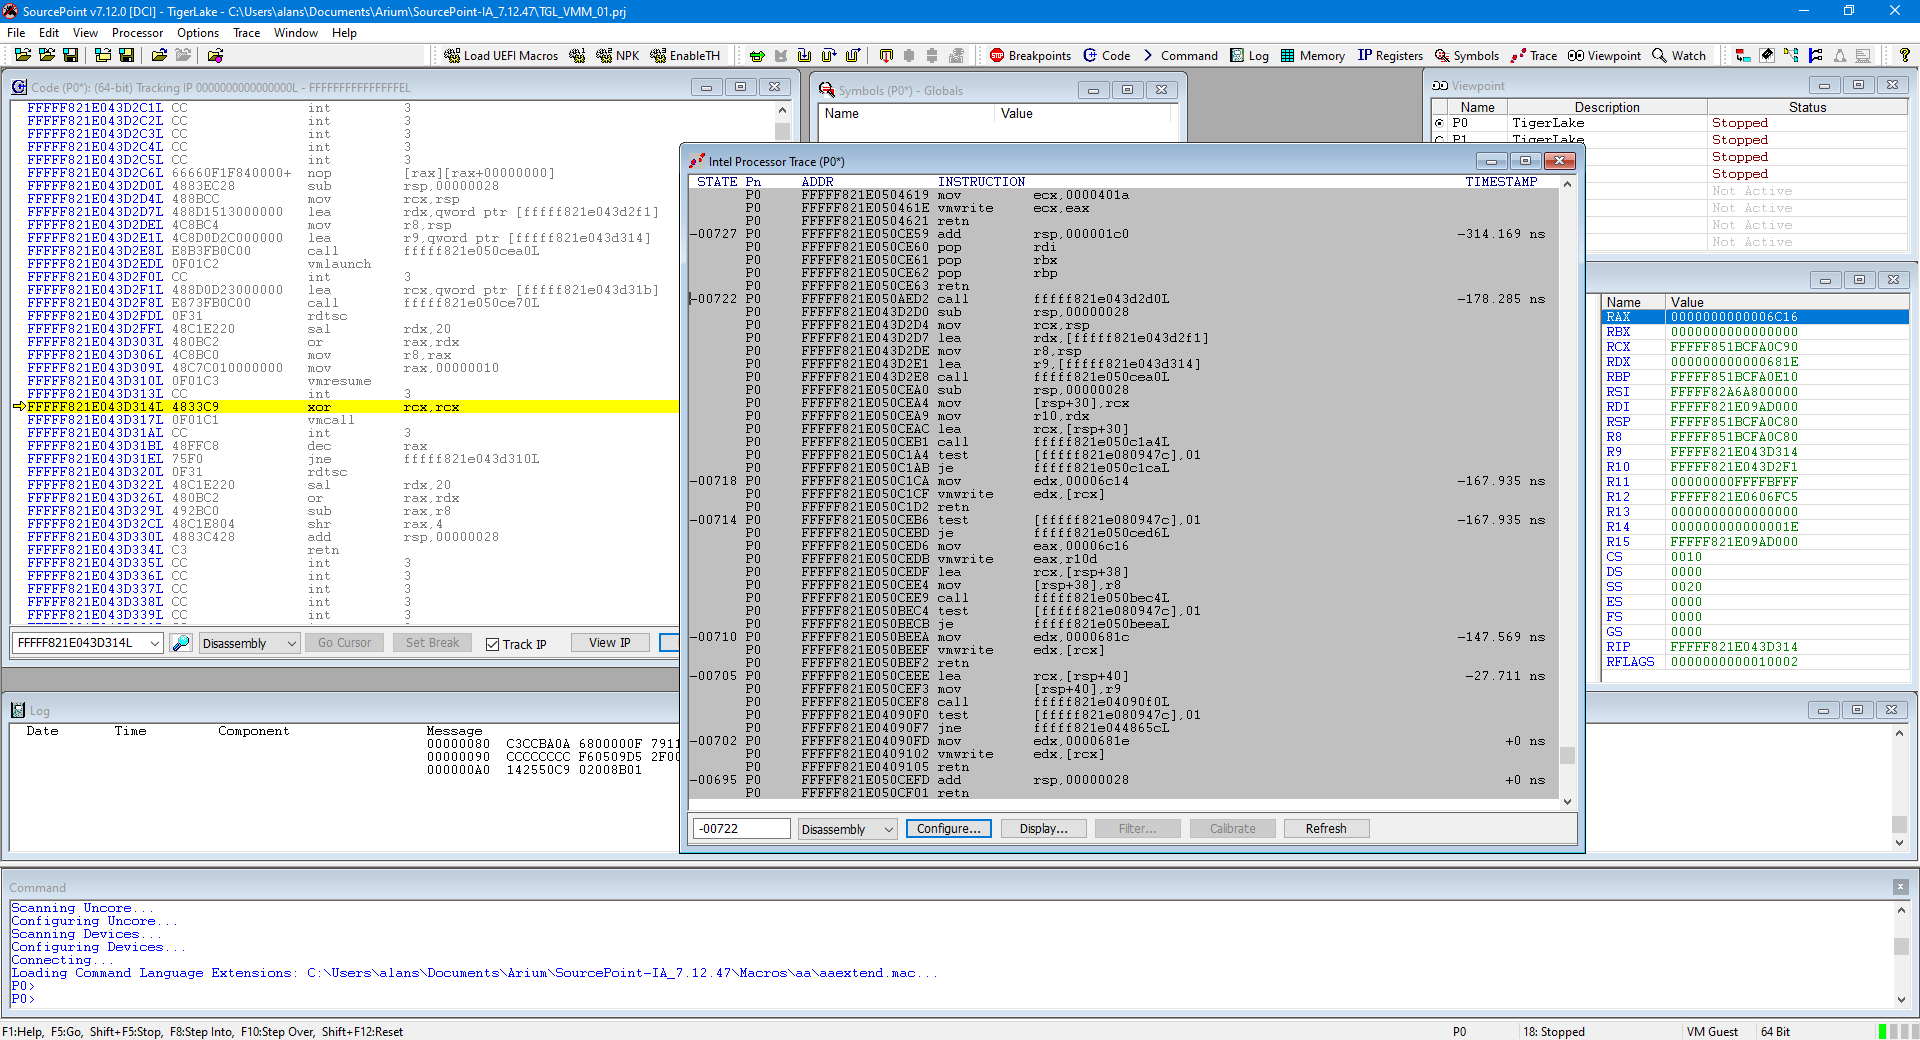
Note that we are in VM Guest mode (down on the bottom right). So, we’ve launched the VM.
Hit Go again:
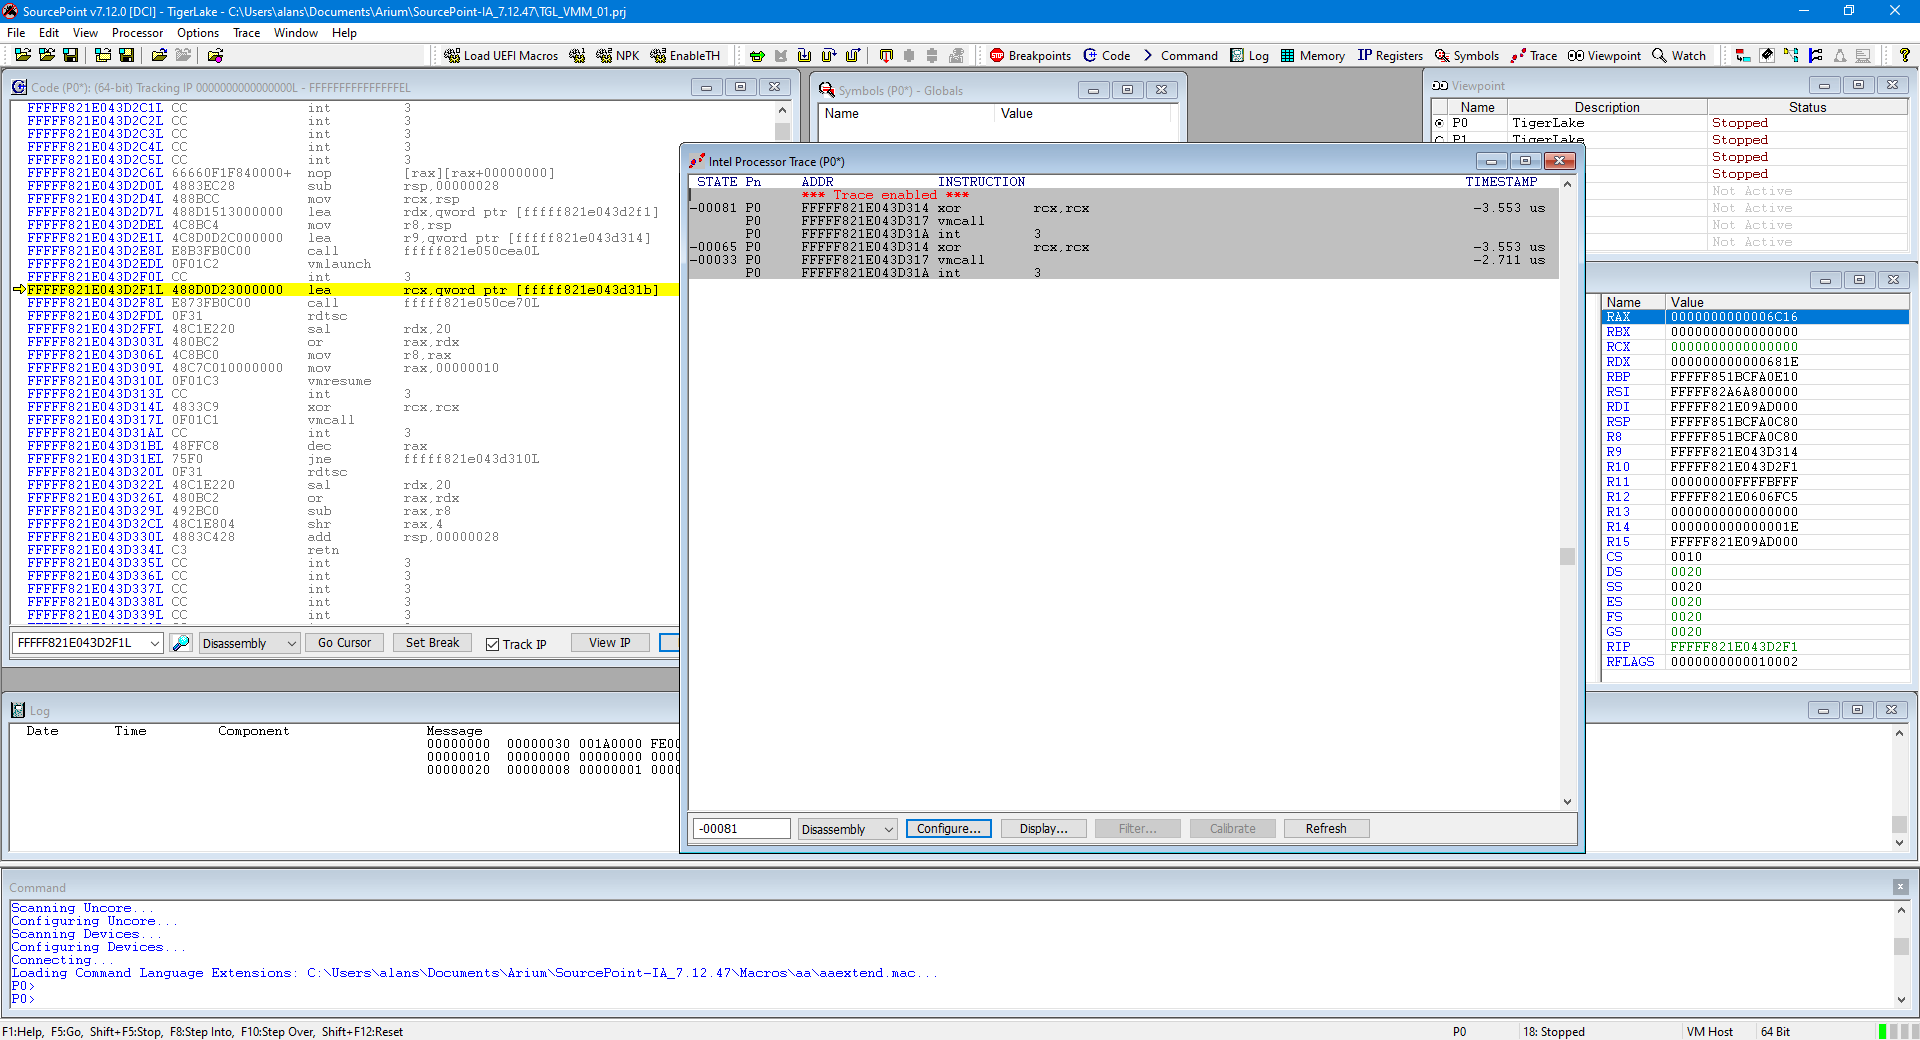
Note that this time, we’re in VM Host mode (we have exited the VM) and there has just been a tiny bit of code executed. Look carefully at the two images. Fascinating, right? Connect the dots between the two images above as code is running for now solely on the BSP.
It’s time now to boot to the Windows desktop, and see what SourcePoint plus WinDbg together shows us. Uncheck the two VMM breakpoints, and just hit SourcePoint Go to run to the Windows desktop. Then, click on the new and improved StartWinDbgEXDI.mac (to be available in the upcoming release).
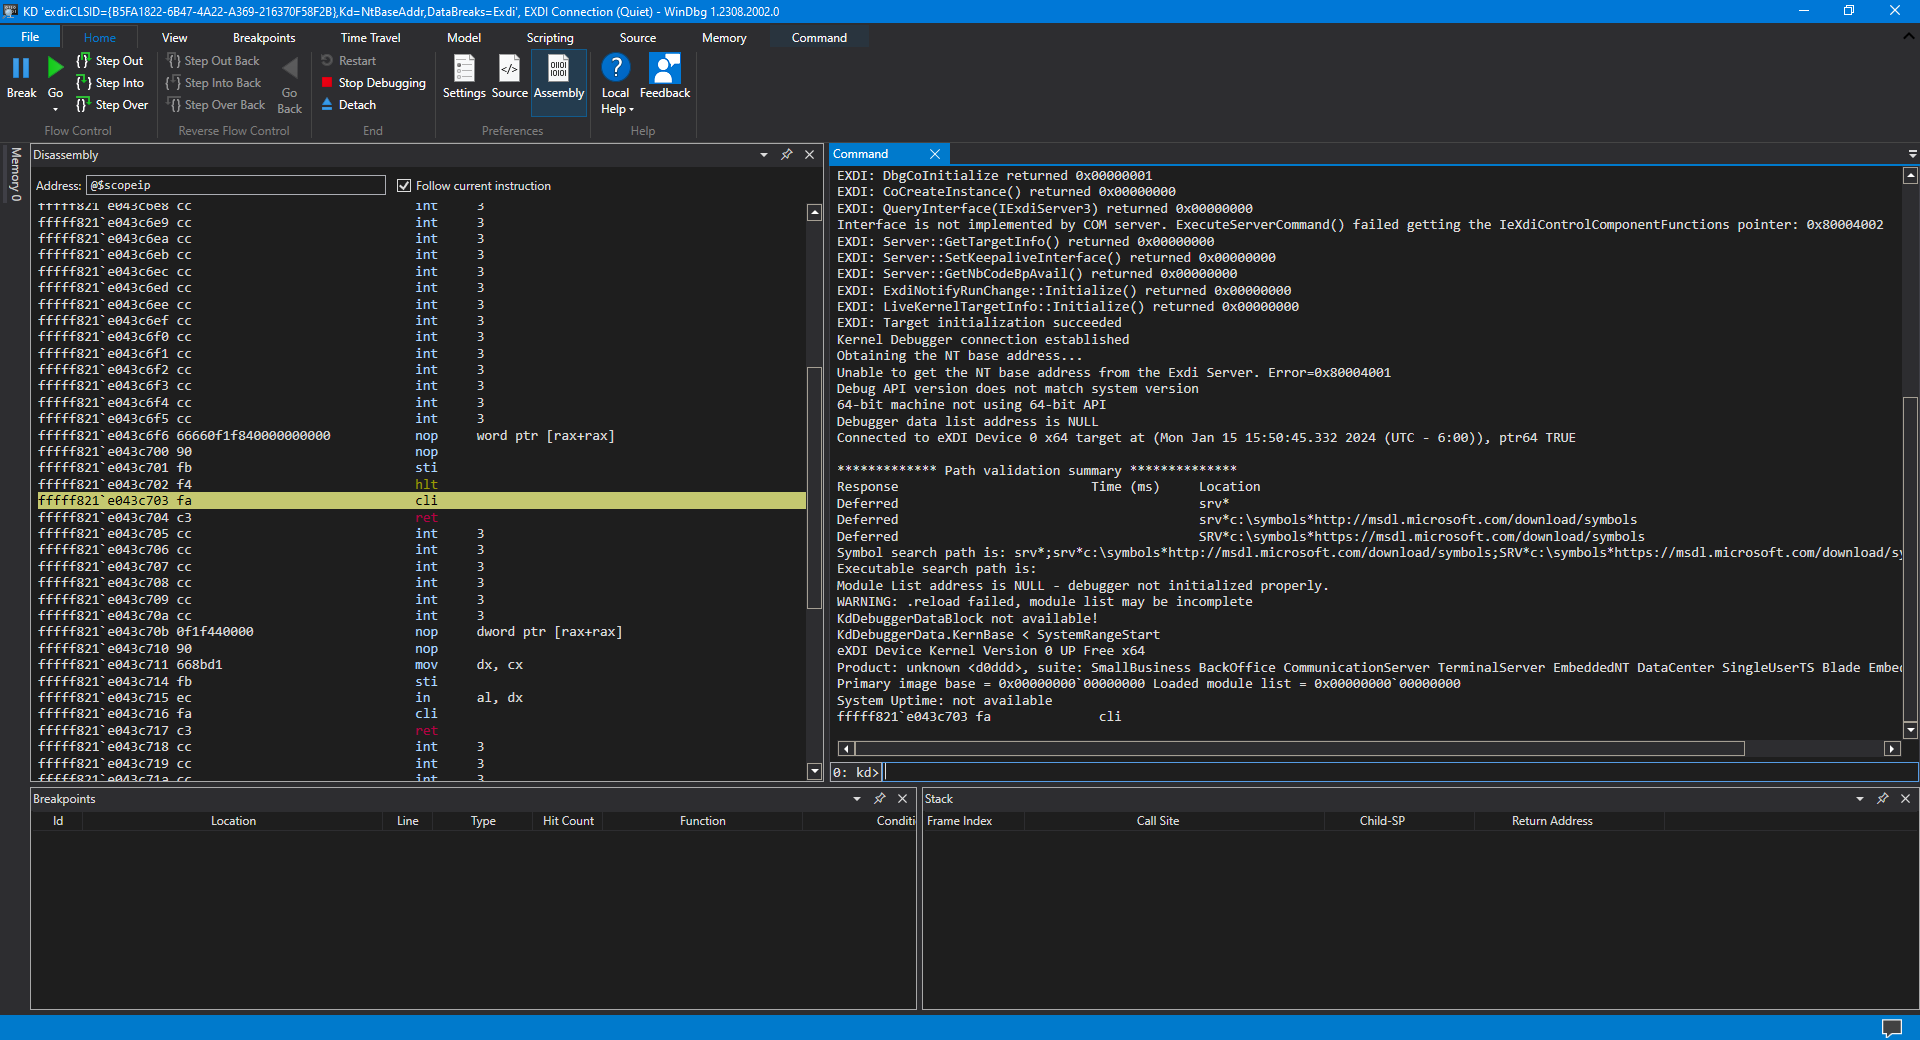
Then launch the new LoadCurrent.mac to see the symbols; but, alas, these symbols seem to be private. Below is an excerpt of the logs from SourcePoint:
WinDbg.mac:LoadImage       Using RIP @ 0xFFFFF821E043C703

WinDbg.mac:FindBase MV Header Found @ 0xFFFFF821E0200000

WinDbg.mac:FindBase PE Header Found @ 0xFFFFF821E02000F8

WinDbg.mac:FindBase PE32+ Header Found @ 0xFFFFF821E0200110

WinDbg.mac:FindBase Debug Directory Found @ 0xFFFFF821E0606210

WinDbg.mac:FindBase Found .data Section @ 0xFFFFF821E0200250, Offset @ 0x600000, Size: 0x1EFAC8

WinDbg.mac:FindBase Detected Module Base @ 0xFFFFF821E0200000, Size: 0x1600000

WinDbg.mac:LoadImage       Using Module Name @ 0xFFFFF821E060AF80

WinDbg.mac:PdbNameToStr    Entry Point is @ RSDS. Adjusting ...

WinDbg.mac:GuidToStr       Entry Point is @ RSDS. Adjusting ...

WinDbg.mac:LoadImage       Symbol file not found. Using cache folder

WinDbg.mac:LoadCurrent     File doesn't exist -> C:\ProgramData\Dbg\sym\hvix64.pdb\452F829D6371E04860518903C19DD5F31\hvix64.pdb
SourcePoint is looking for hvix64, for which we don’t have the PDB file. Also, we can’t find the KdVersionBlock, which points to the NT kernel’s base address, so we don’t have any symbols in WinDbg either. In my next article, I’ll show how symbolic debug can be performed. In the meantime, try using Intel PT and Intel Architectural Event Trace creatively – lots can be learned even without source and symbols.