
In this third article in the series, I continue to explore the “undebuggable” early part of the Windows boot flow, using our SourcePoint WinDbg product in conjunction with some of the inherent Intel trace features, such as Last Branch Record (LBR) and Intel Processor Trace (Intel PT).
In Part 1 of this blog series, I introduced some of the beta capabilities of SourcePoint WinDbg, where I used our support of the EXDI protocol over Intel Direct Connect Interface (DCI) to connect to an AAEON UP Xtreme i11 board. The UP Xtreme i11 Tiger Lake Celeron board supports DCI (DbC2) “out of the tin”, so it makes an ideal and reasonably inexpensive target for debugging on real hardware. And using JTAG with EXDI allows us to debug things we normally wouldn’t be able to see with the regular Microsoft kernel debugger, where the debugging agent is actually running on the target. So, with SourcePoint WinDbg you can debug firmware and extremely low-level code.
In Part 2, I continued with a deeper dive on debugging the Windows hypervisor (HV) and secure kernel (SK). Some very good friends pointed out a few flaws in this original blog, so I’m going to highlight these, retrace my steps, and elaborate on how the hypervisor, secure kernel (VTL 1), and regular kernel and user code interact, particularly in the context of VM Host and VM Guest modes on the target. We’ll look at the code, and use what trace features are currently supported to see what’s happening under the hood. This is as yet, as of the time of this writing, still beta software, so it’s not perfect. But production software is coming soon.
Here we go!
Firstly, the transitions between the kernels and the hypervisor are much, much easier to see if you shrink the number of logical processors down to 1. You can do this from a Windows CMD window with:
> bcdedit /set numproc 1
In Part 1 of this blog series, I had all threads running: making it difficult to see the transitions.
But, as I’m an old UEFI guy, I like doing it from within the BIOS menu.
Power up the UP Xtreme i11 board and hold down the F7 key takes you to a password prompt within the UEFI shell:
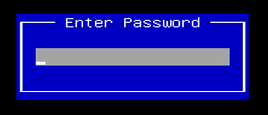
The AAEON password for the advanced BIOS menu is “upassw0rd” (yes, that is a zero and not a letter “Oh”). Then go CRB Setup > CRB Advanced > CPU Configuration, disable Hyper-Threading, and set Active Processor Cores to 1:
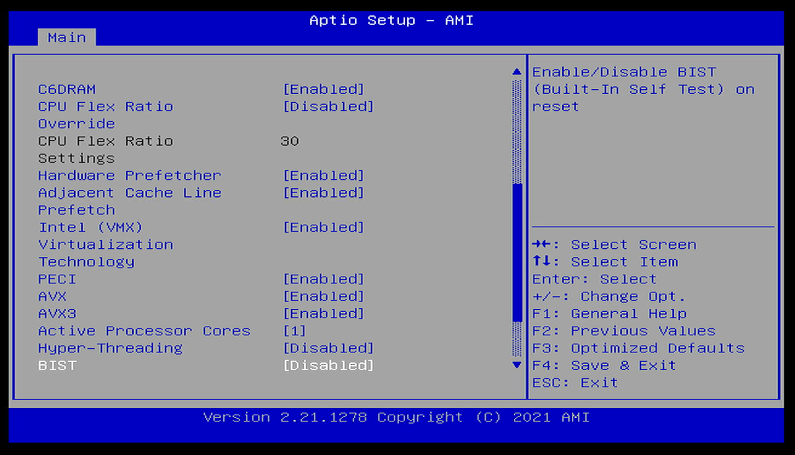
Then hit ESC a few times, and make sure to save the configuration and then the platform will reboot.
Author’s Note: Exploring the advanced BIOS menus within the AAEON boards is worth the price of admission by itself. I’ve spent countless hours in there myself, exploring the options, changing things, and seeing what happens. This is fun, but be warned – it is easy to brick the board, especially when you’re like me and you’re not quite sure all the time what you’re doing. On the other hand, it’s easy enough to pull the CMOS battery out for a minute to reset it back to the factory BIOS settings, or worst case re-flash it. 😊
Anyway, back to our main topic.
While still in the UEFI shell, launch SourcePoint and set a VM Launch breakpoint:
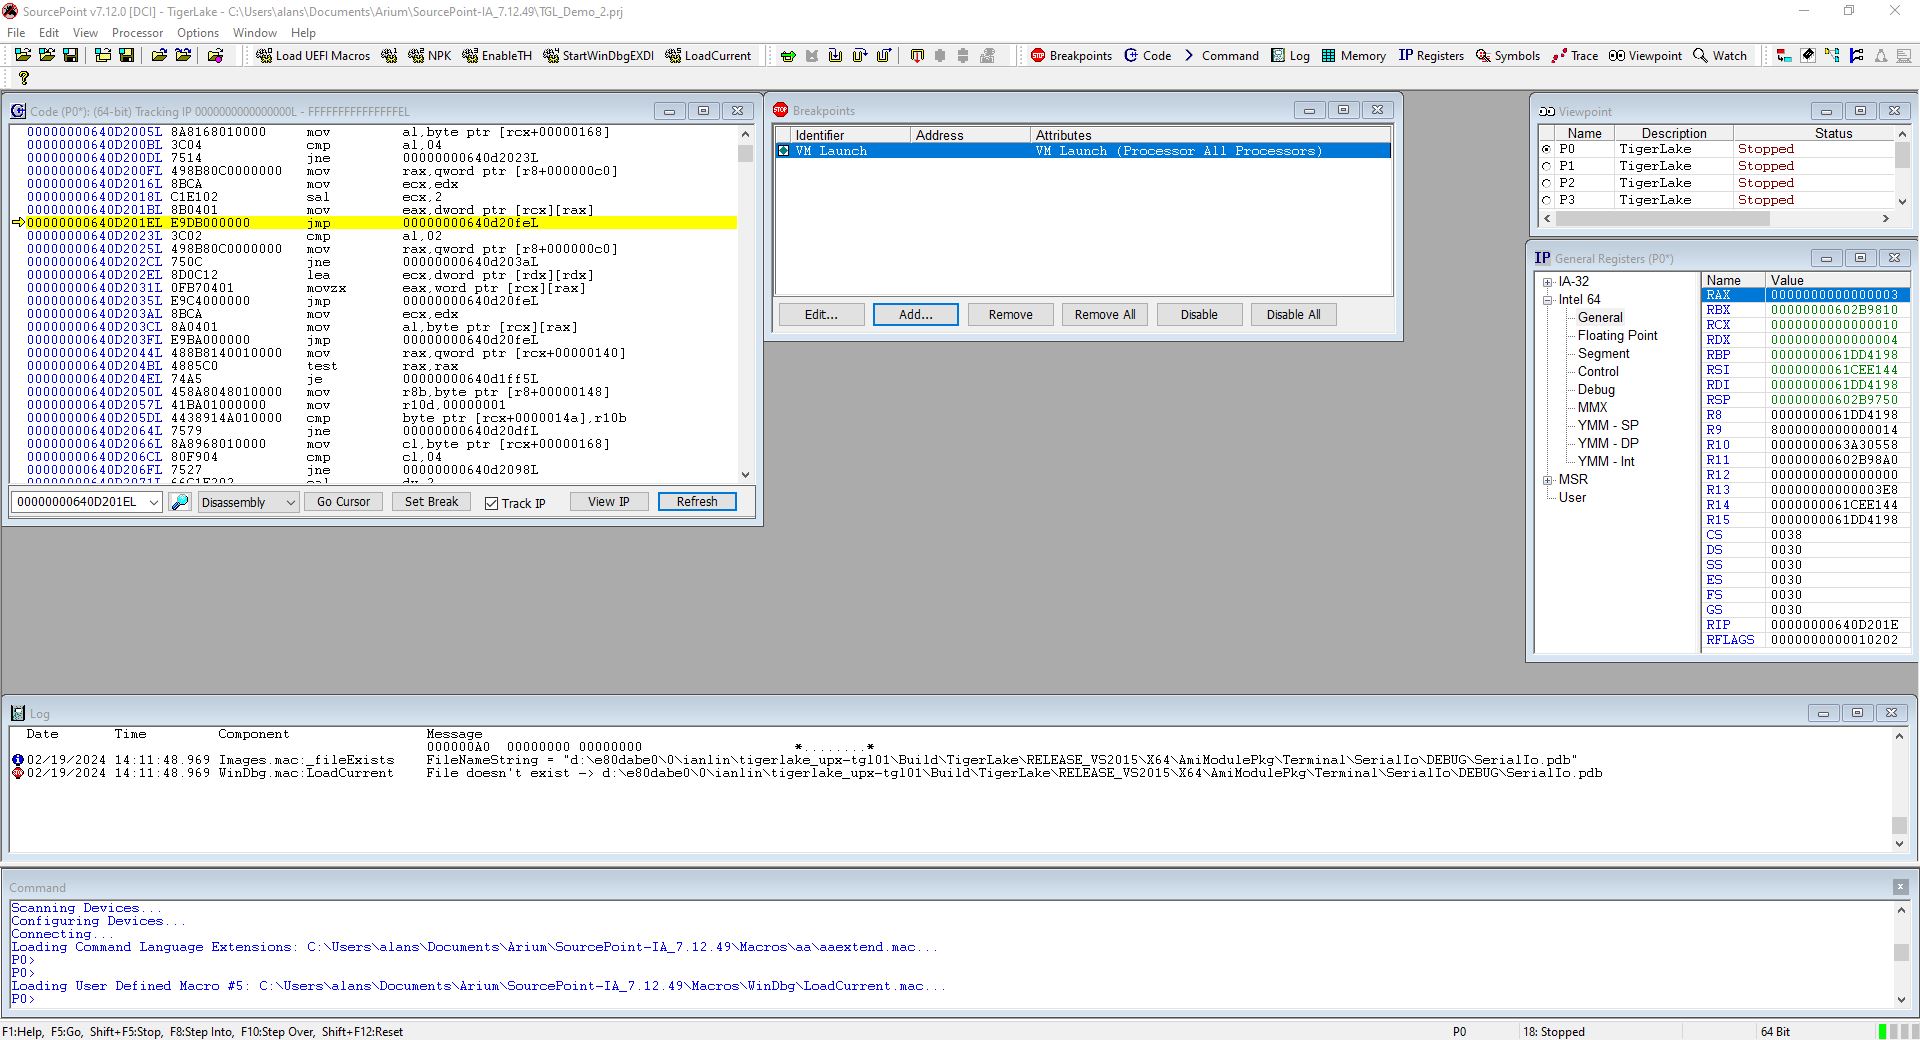
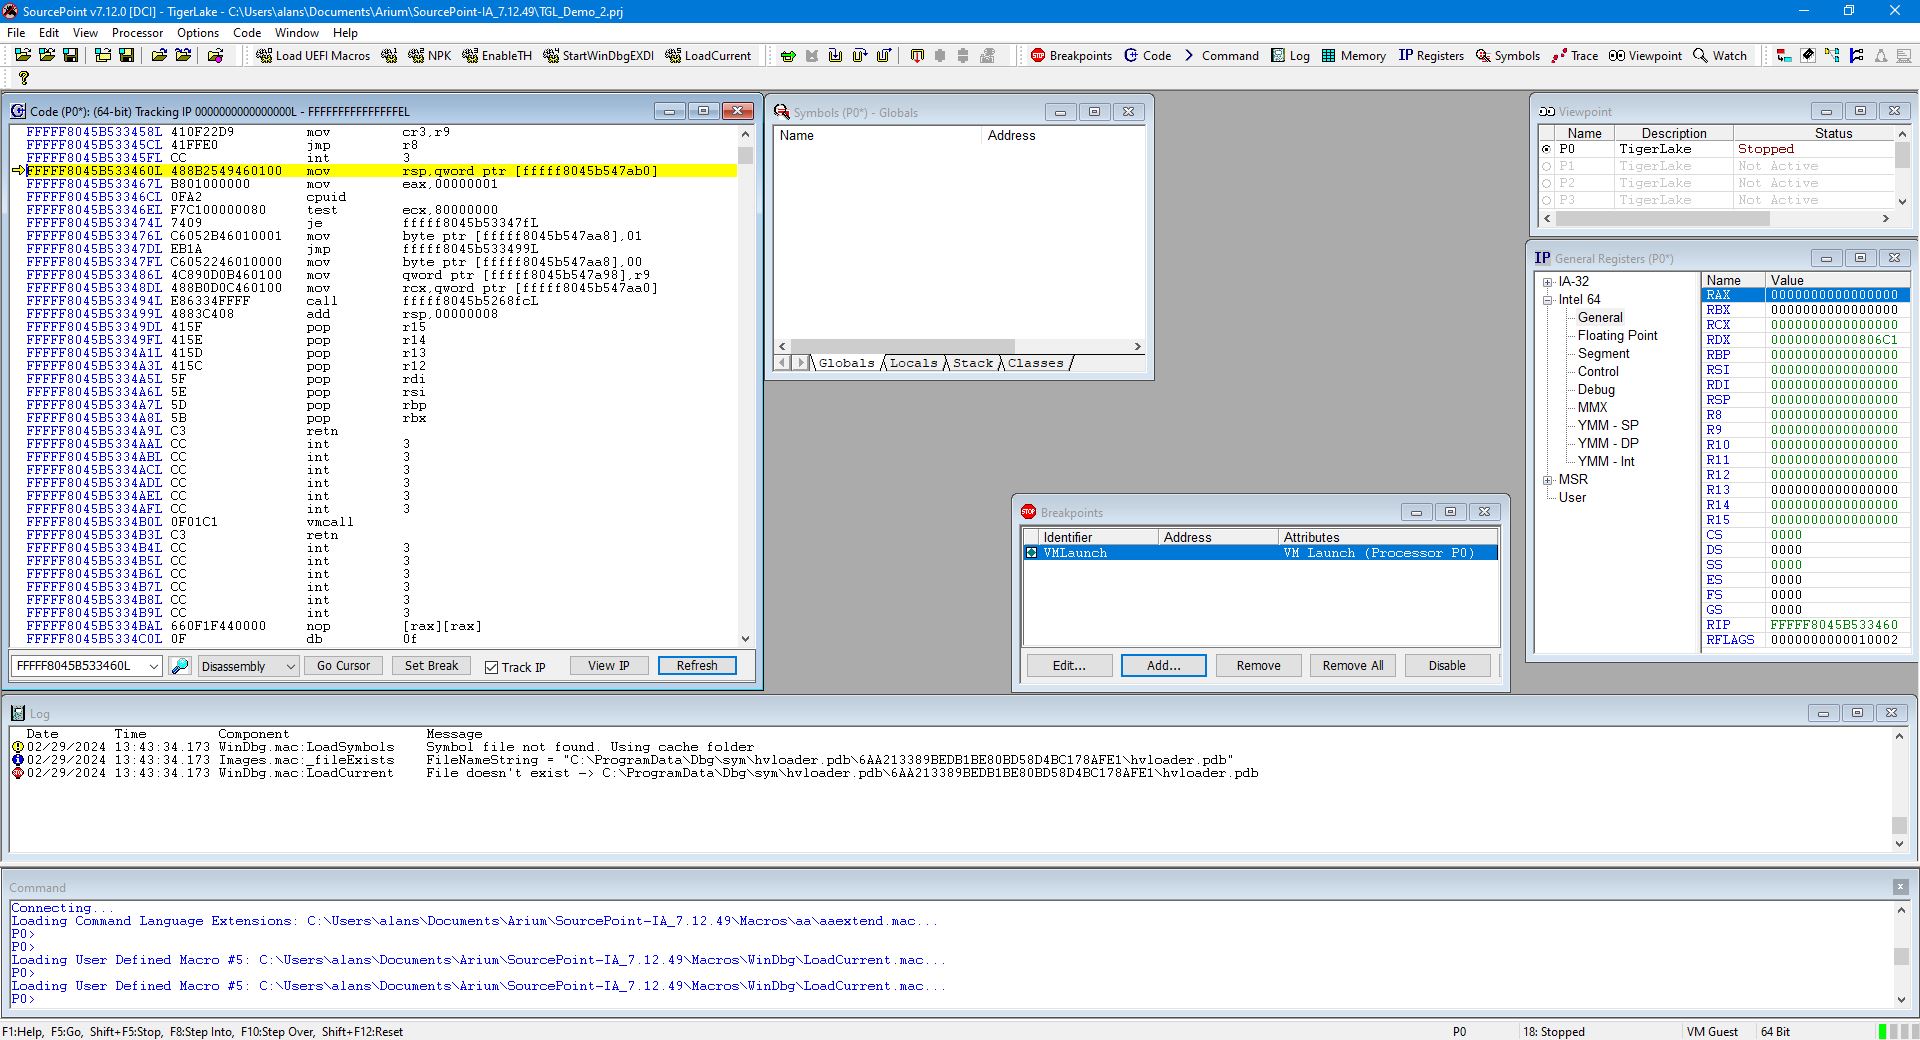
Then hit Go. It will break at the first VM launch, as it’s the hypervisor that starts the Root partition. Using the LoadCurrent button shows that it we are in the hvix64 module, for which we don’t have symbols, as can be seen from the SourcePoint Log window:
Hit Go again. This time, we stop in hvloader. We don’t have symbols for that, either:
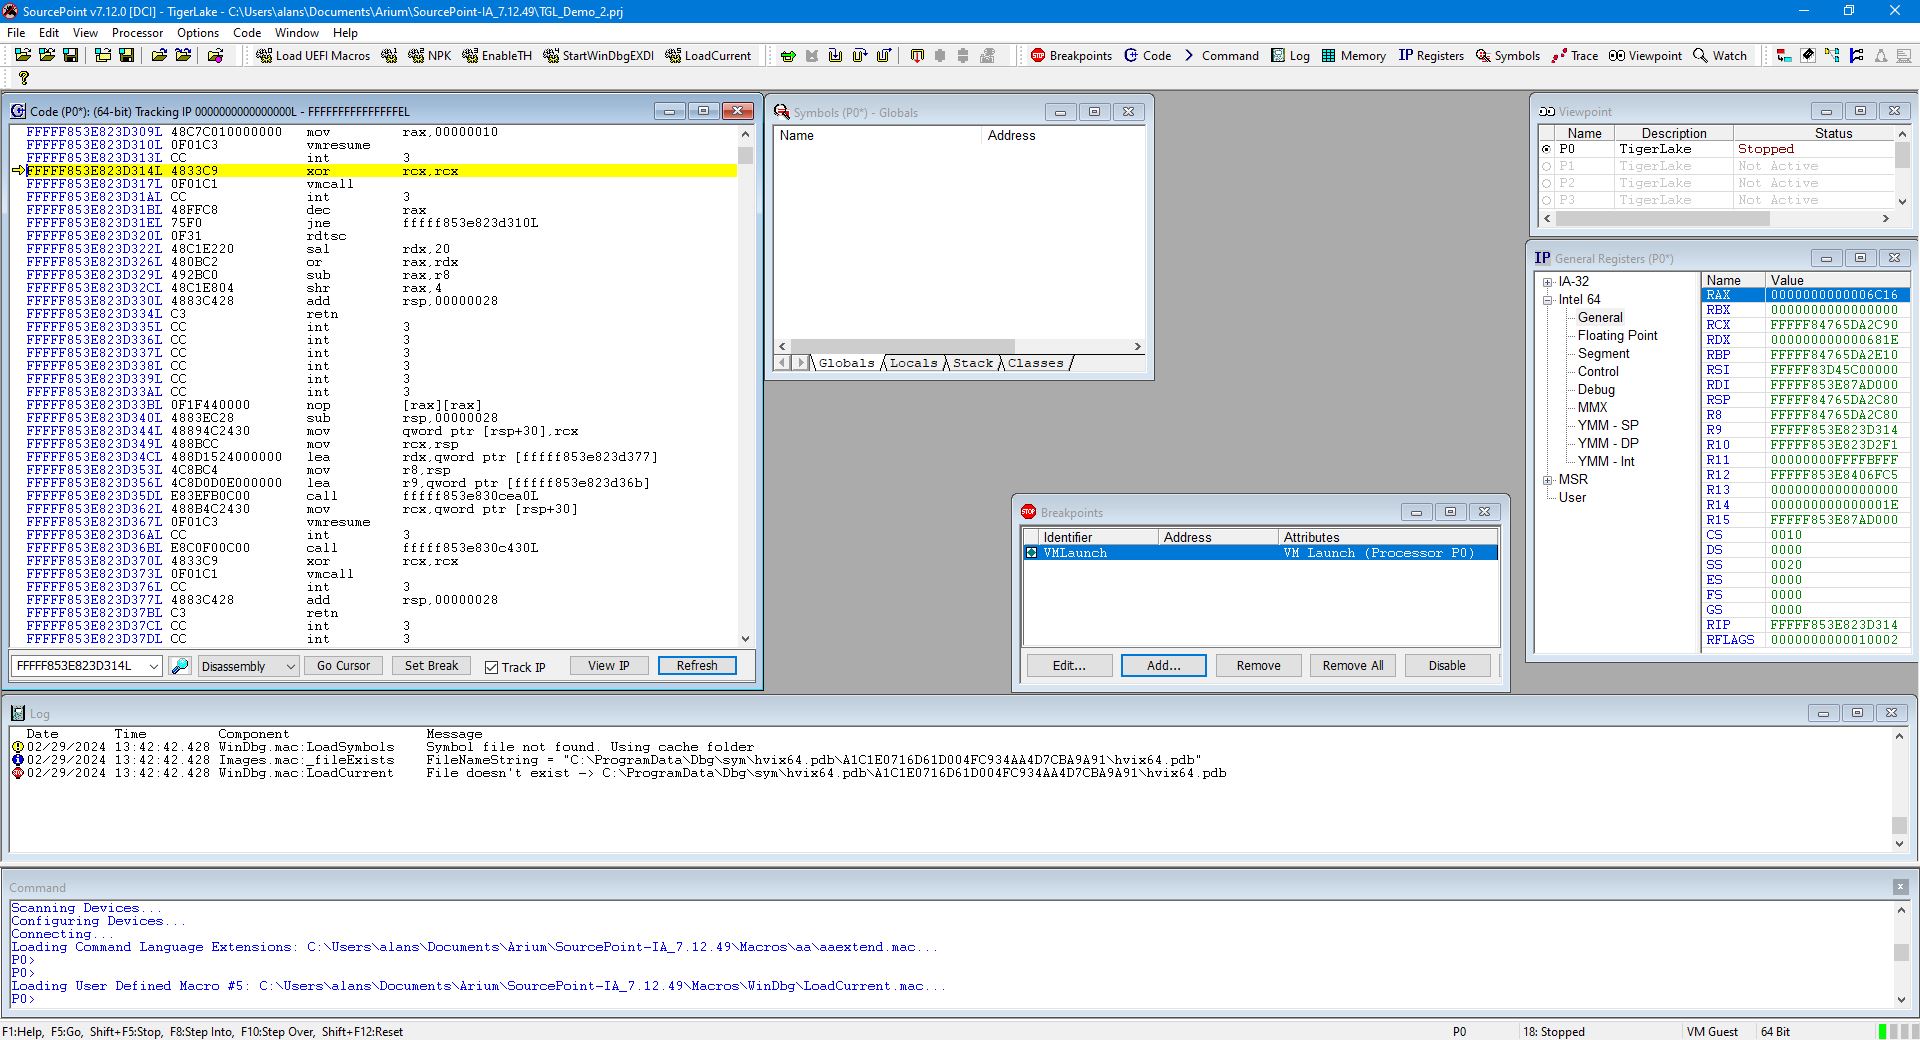
Hit Go a third time. This time, we stop in securekernel:
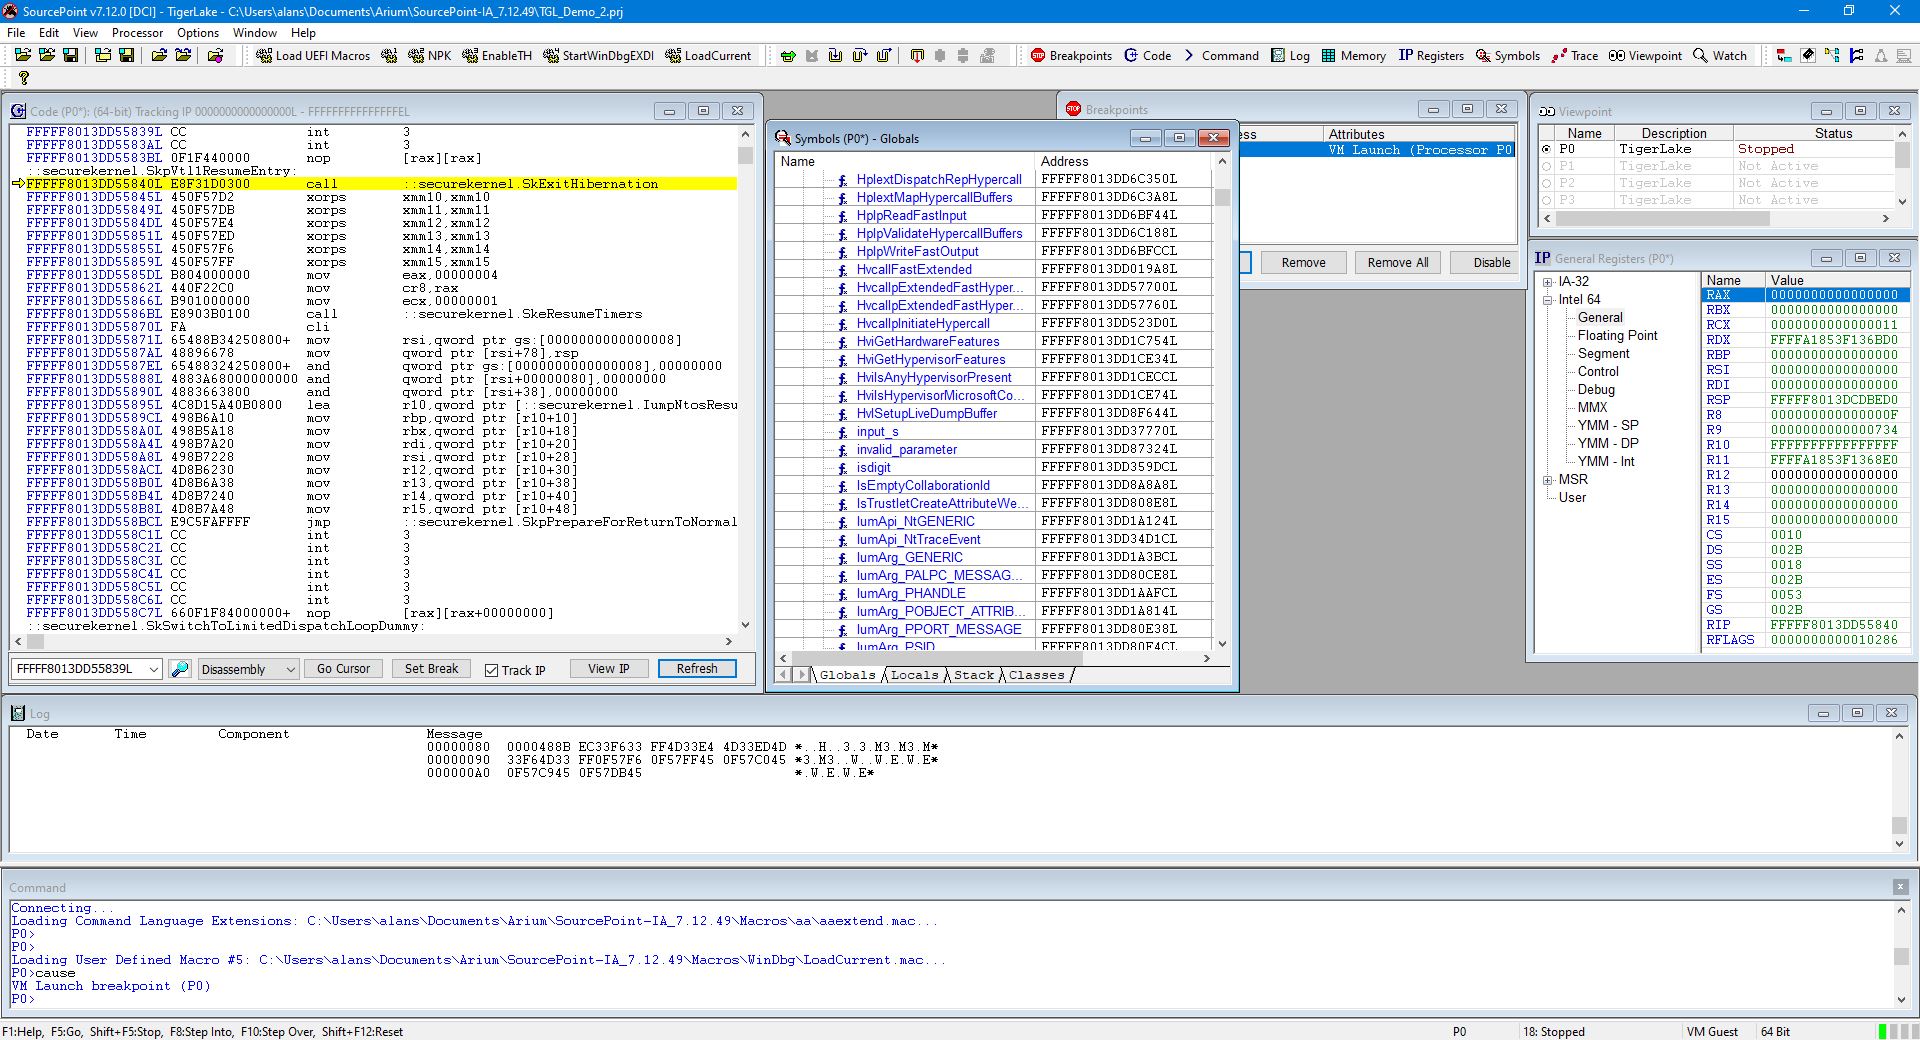
Interestingly, the securekernel.pdb is in fact publicly available from the Windows symbol server, and we do have symbols here (thanks to Satoshi for pointing this out) – only a small subset is displayed here:
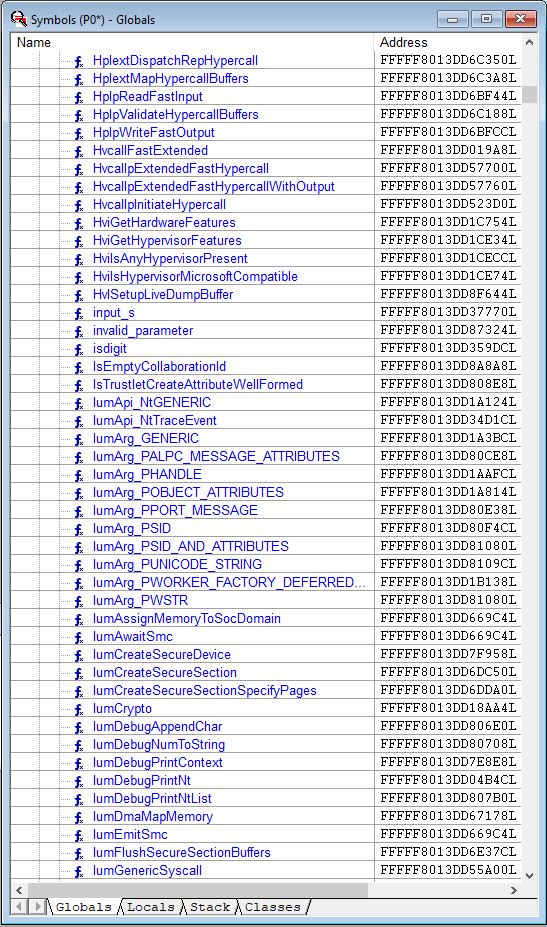
With symbols, debugging is much better and easier. We can right click on any of these functions and set breakpoints; single step through them; look at their code in a separate window; and so on. And you can see the kernel APIs that are implemented in the secure kernel, and compare them with the VTL 0 kernel. An example is SkmmCreateProcessAddressSpace, which differs from its VTL 0 counterpart because the secure kernel does not implement a full range of system capabilities, but rather hand-picks which system calls it will forward to the VTL 0 kernel.
Note that this is the last VMLaunch encountered. If you hit Go again, and the target just runs and runs normally. This makes sense; and implementing VMResume is on the work docket.
I could explore this for days/weeks/months/years; and I probably will. Windows is huge, and this is a really interesting journey. Users of SourcePoint WinDbg will be able to do the same, once the beta software goes publicly available.
In the meantime, I thought it might be helpful to learn about some of the work items that are underway; particularly in the context of taking advantage of some of the great Intel trace features and applying them to debugging the undebuggable.
In this next part of this blog, I’ll show off instruction trace in detail. In a future episode, I’ll cover event trace.
Note that there are two different types of useful execution trace supported by Intel: LBR and Intel PT. I’ll cover each one of these separately.
LBR uses MSRs to capture to/from address pairs, that are triggered when branch instructions (like JMP, loop and CALL) are executed. As there are a limited set of MSRs dedicated to LBR (this is CPU dependent, but usually captures a few hundred assembly language instructions), the capability is rather restricted. But LBR is available directly from CPU reset, which is a bonus for early platform boot problems and UEFI SEC/PEI and pre-memory-initialization debugging; and LBR certainly behaves differently compared to Intel PT when it comes to Windows debugging, as we shall see.
Intel PT, unlike LBR, requires system memory to be initialized. But, since most of the debugging we’ll be doing with SourcePoint WinDbg in Windows has memory available, this is not an issue. Intel PT streams execution trace in near-real-time to system memory. Upon a target halt, this compacted trace data is extracted out of system memory via JTAG (which can make it slow), and parsed and displayed within the SourcePoint environment.
Starting from scratch again as above, we set a VM Launch breakpoint, and boot from the UEFI shell, breaking at hvix64. Here’s what the LBR and Intel PT windows look like:
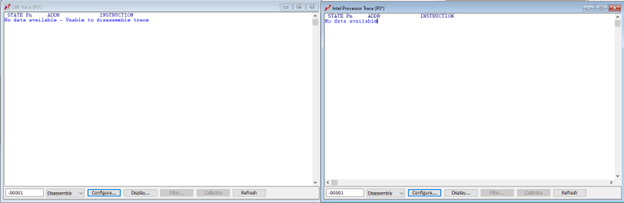
There’s no trace! As it turns out, that is correct. For LBR, the MSR IA32_DEBUGCTL[0] is cleared by the launch, so LBR trace stopped. And CR3, the base address of the page translation tables, gets loaded with a new value when transitioning in and out of VMs. On VMM breakpoints, we’ve stopped where a new CR3 value has just been loaded; however, the trace was recorded with a different CR3 value. Intel PT does in fact track CR3 changes, and I’ll write about that later. But LBR has no such mechanism; it may not be easy to fix, so the use of LBR trace may be restricted in the case of guest <-> host transitions.
This is fun. Just to repeat:
The first VMLaunch breakpoints stops in hvix64, for which we have no symbols.
The second VMLaunch breakpoint stops in hvloader. We don’t have symbols for that, either.
The third VMLaunch breakpoint stops in securekernel. We do have symbols here.
You can single-step through the secure kernel, and both LBR and Intel PT work fine:
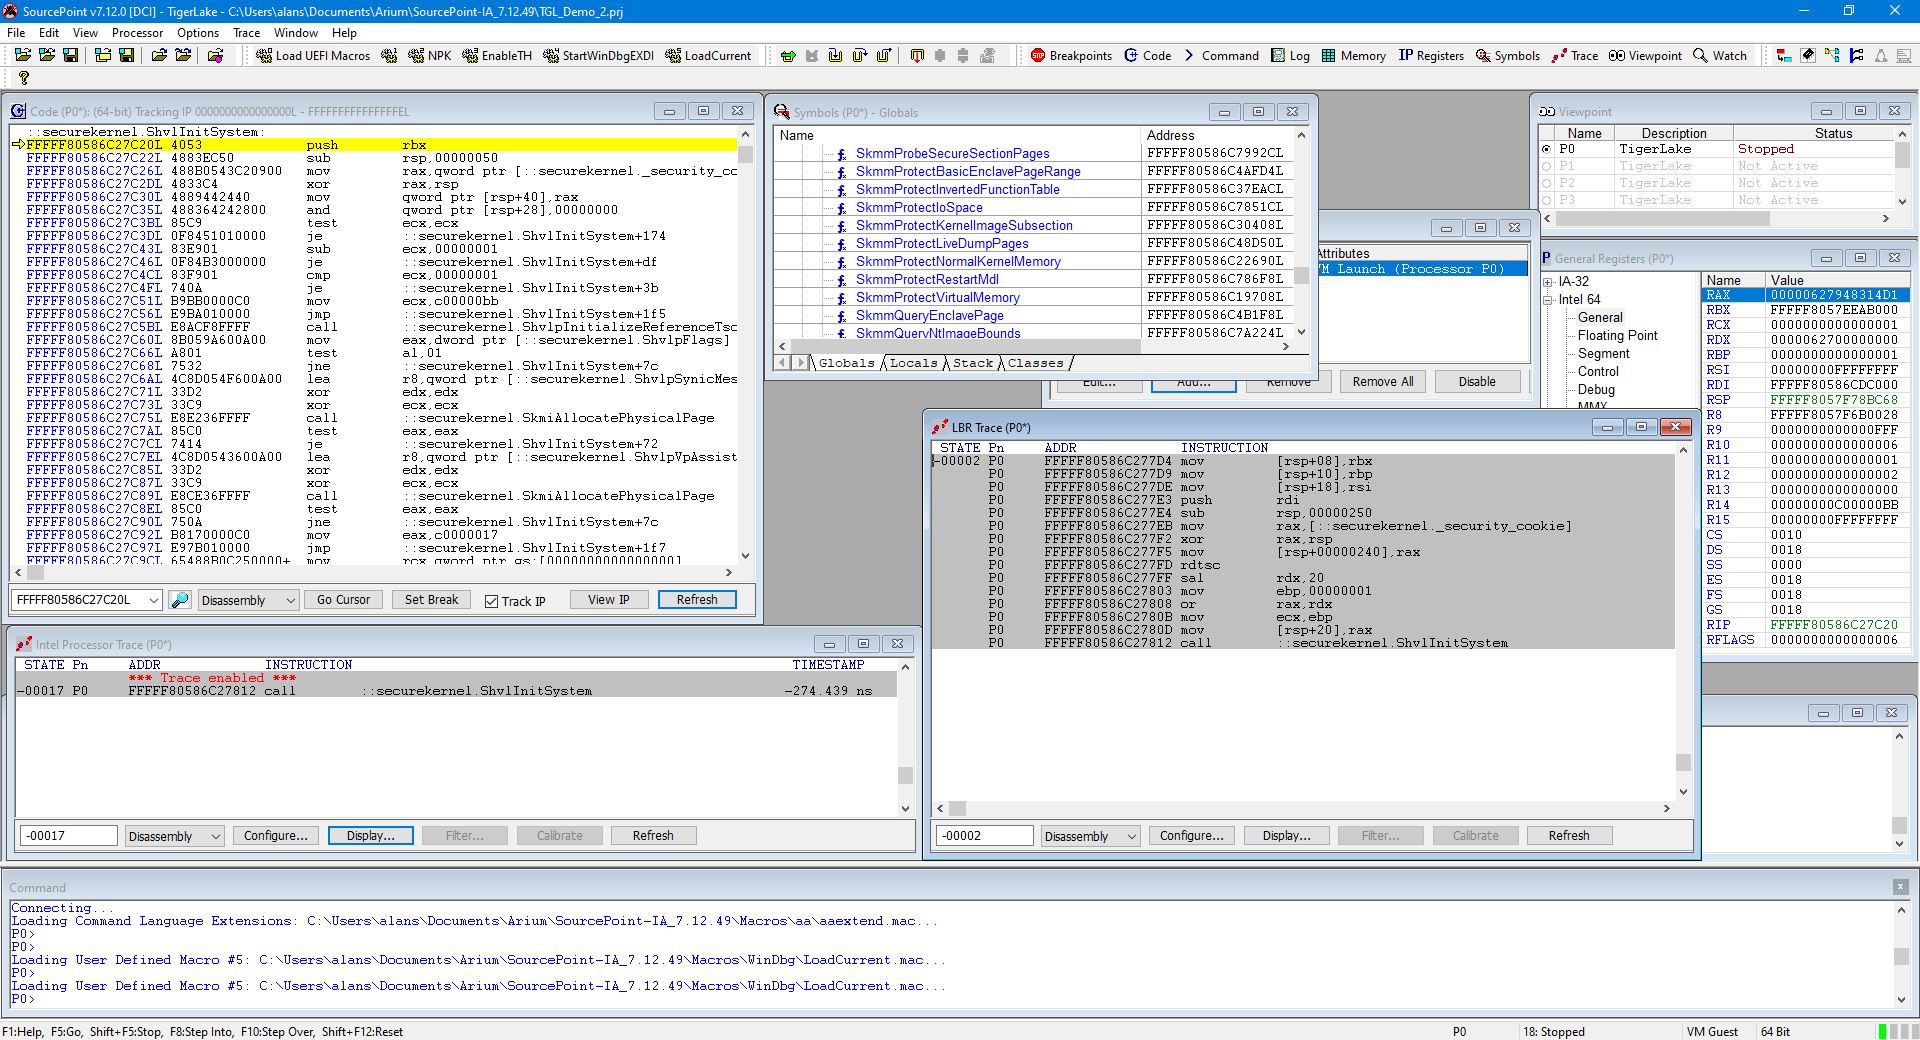
Look at the LBR and Intel PT traces carefully. Because LBR uses registers and Intel PT uses a trace buffer, when you single-step, LBR keeps building up on the traceback step by step by step; whereas Intel PT rebuilds the trace display after each halt; so, the two technologies are somewhat complementary. Of course, the Intel PT window would be filled up with much more useful trace data if a breakpoint were set somewhere in SK and you ran the target directly to it.
What does this prove? Trace (both Intel PT and LBR) work well in host or guest mode. Tracing within the secure kernel works. Tracing through transitions from host to guest and vice versa is being worked on.
There’s a lot more to write about, and this series will continue as I discover more interesting things about the Windows hypervisor and secure kernel.