
I’ve been experimenting with a prototype of our SourcePoint JTAG-based debugger integrated with WinDbg, using the “new” EXDI interface as provided by Microsoft. When complete, it will combine the utility and broad adoption of WinDbg with the power of our SourcePoint debugger, with its easy-to-use trace features such as Architectural Event Trace (AET), Intel Processor Trace, Trace Hub, etc. This will enable us to Debug the Undebuggable, so to speak. Here’s a sneak peek.
The SourcePoint debugger is a fully-featured hardware-assisted debugger; that is, it uses JTAG at an extremely low level to communicate directly with the Intel and AMD CPU silicon, and uses run-control to put them into probe mode. This initiates the debugging action at the chip level, as opposed to using agent-based services (i.e. dependent on firmware or OS support). That enables us to debug the undebuggable – with apologies to Andrea Allievi for co-opting the title of his recent article on this topic: https://www.andrea-allievi.com/blog/debugging-the-undebuggable-part-1/.
Those familiar with SourcePoint know that it can debug Intel targets via open-chassis (using the XDP header, dedicated controllers, and hardware targets that are available to the privileged few) and closed-chassis (using the Intel Direct Connect Interface (DCI) over a custom USB cable). For more information on using the DCI capability on publicly available boards, see our video JTAG Debug on the AAEON UP Xtreme i11 using Intel Direct Connect Interface (DCI) or the Getting Started Guide for the AAEON UP Xtreme i11. In addition, DCI in the wild has also been documented for example in Satoshi Tanda’s excellent Debugging System with DCI and Windbg.
The magic behind connecting a JTAG-based debugger with WinDbg is associated with the Microsoft Extended Debugging Interface (EXDI), that is documented, among several places, at Configuring the EXDI Debugger Transport, and GitHub WinDbg-Samples/EXDI. In addition, there have been several articles discussing its use recently, among them Andrea Allievi’s blog above, as well as Our Windows Man’s What EXDi can do for you that DCI can’t. EXDI is an adaptation layer between a software debugger and a debugging target. The Debugging Tools for Windows supports kernel debugging using EXDI starting with Windows version 22000. EXDI extends WinDbg by adding support for hardware debuggers (e.g. JTAG-based, or GdbServer-based). As such, the whole promise of EXDI is to introduce new debugging capabilities that cannot be provided by WinDbg alone.
A block diagram of how WinDbg integrates with our SourcePoint JTAG-based debugger is as below:
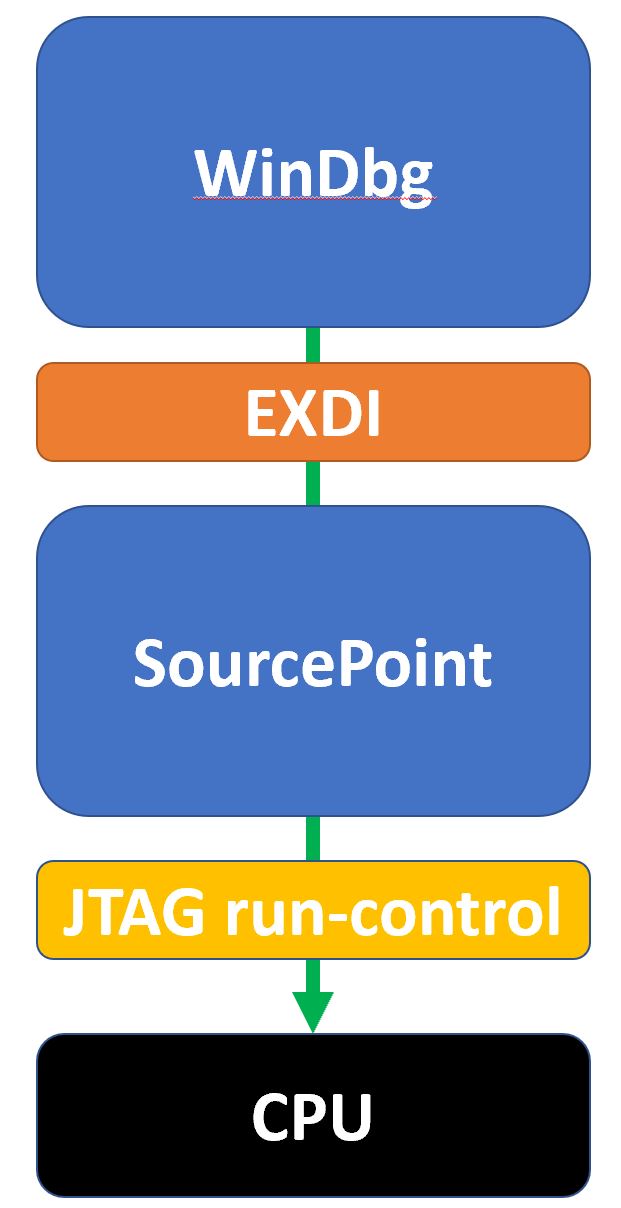
In our approach, WinDbg controls the show: things work best when most of the debugging operations are under control of WinDbg. It doesn’t like having the rug pulled out from underneath it by SourcePoint. However, with some care, you can also use some of the SourcePoint debug and trace functionality to take your debugging to the next level.
In this article, I’ll introduce a prototype of running WinDbg in conjunction with Intel’s Architectural Event Trace (AET). AET is special in the context that the only way to activate and use this feature is via JTAG. If you want to learn more about AET, read my blog at Intel Architectural Event Trace (AET) in action or watch the YouTube video UEFI Debug with Intel Architectural Event Trace. The combination of the two is extremely powerful, and gives insight into code flow and event trace at the same time. So, it’s a melding of both static and dynamic analysis, as you’ll see. There are many other examples, such as combining WinDbg with Intel Processor Trace, or combining WinDbg with the unique AMD Advanced Breakpoints, or using SourcePoint VMExit and VMLaunch breakpoints to trap the Windows hypervisor, that I’ll write about in the future.
A word to the wise: I’m working with prototype software. We’ll put this into production in the next couple of months. There are a couple of things missing, such as synchronizing the Windows kernel symbols between WinDbg and SourcePoint. And in terms of stability, these are “choppy seas”; often, Windows doesn’t like to be interrupted by a JTAG hardware debugger, and it does some harsh things to SourcePoint. But, mitigations are available and are being developed, and the powerful capabilities now available merit a little frustration until things are “just right”.
In this simple example, I’ll just illustrate how to use AET to trace what the Windows kernel is doing “at rest”, in terms of reading and writing MSRs. Interestingly, while Windows is just sitting there, the kernel is continuously doing some magical things with MSRs. Let’s look at a really simple way to check out this event activity.
Firstly, I’ve configured my machine with the needed EXDI DLL needed to connect to the target through JTAG (note that you don’t have this yet, of course, as it’s a prototype). I’ve loaded Windows 11 onto my UP Xtreme i11 board was referenced above, and booted it. Then I launched SourcePoint, and connected with the target over DCI:
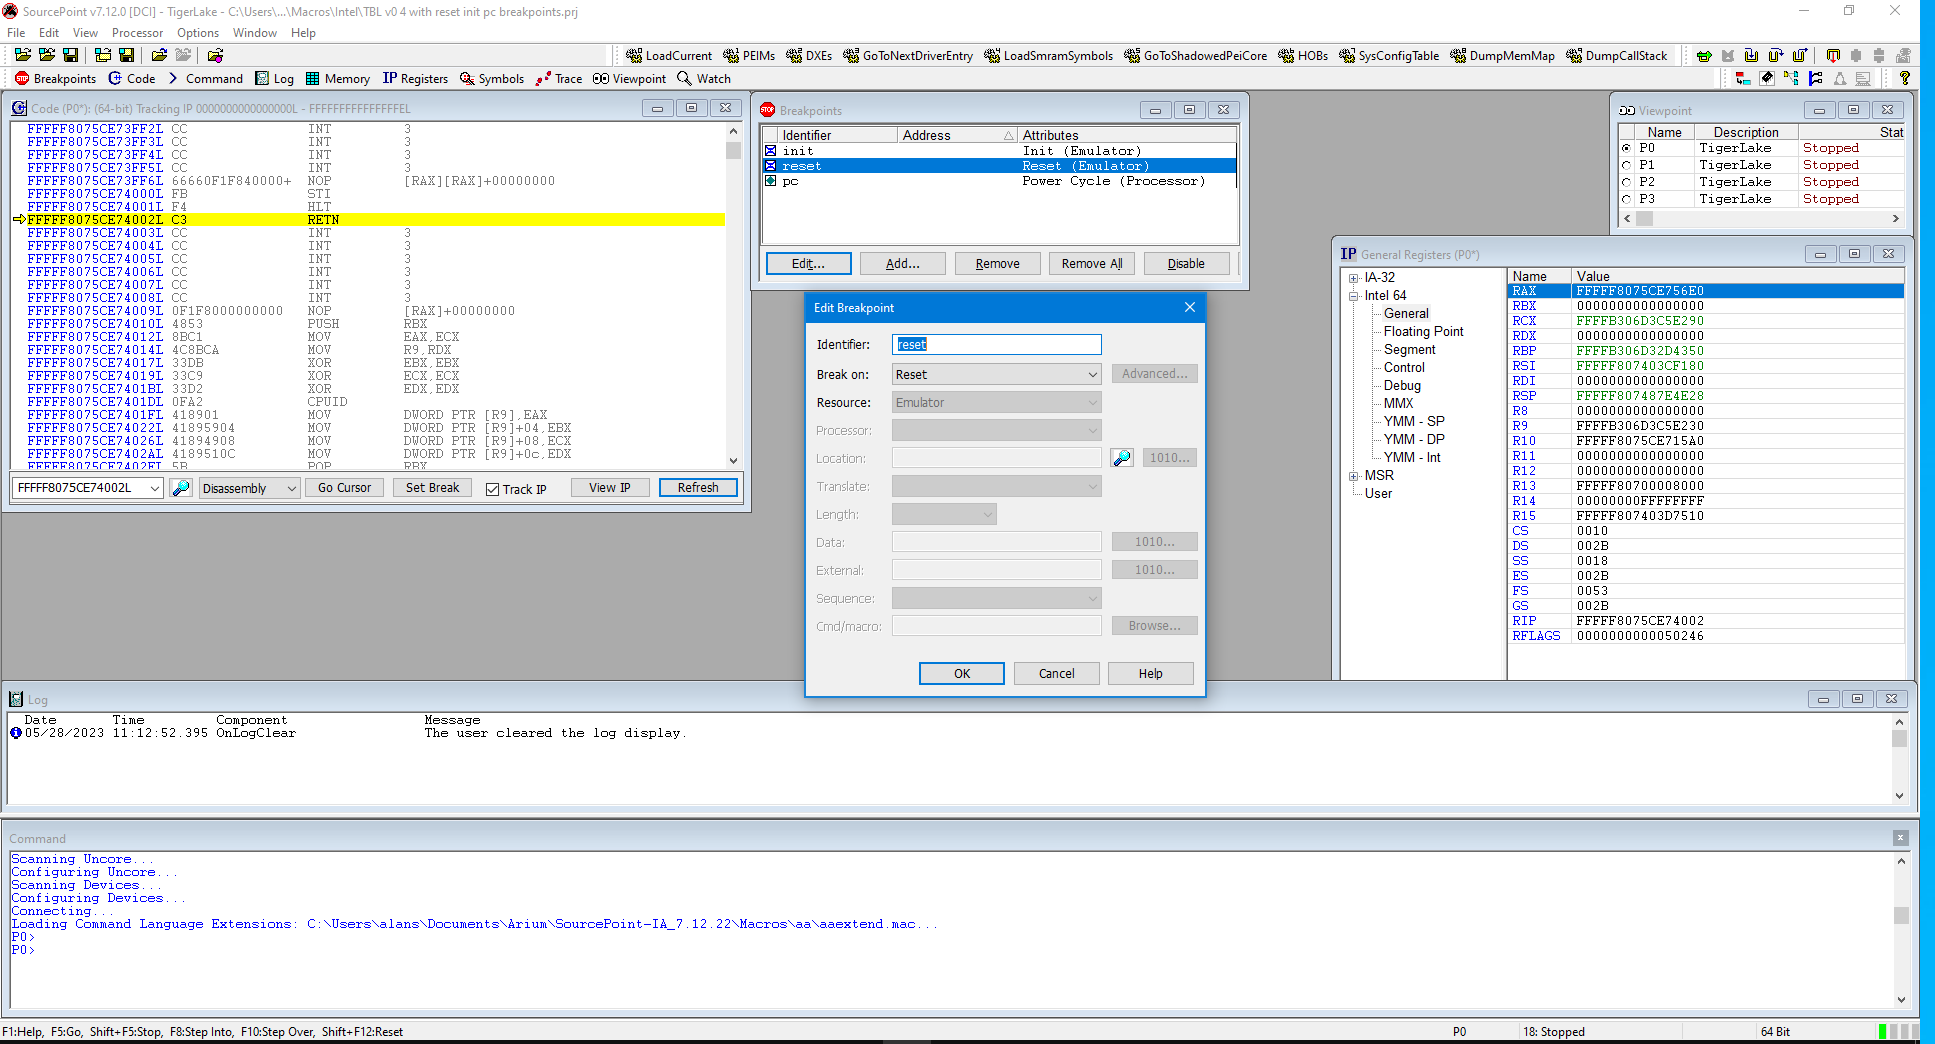
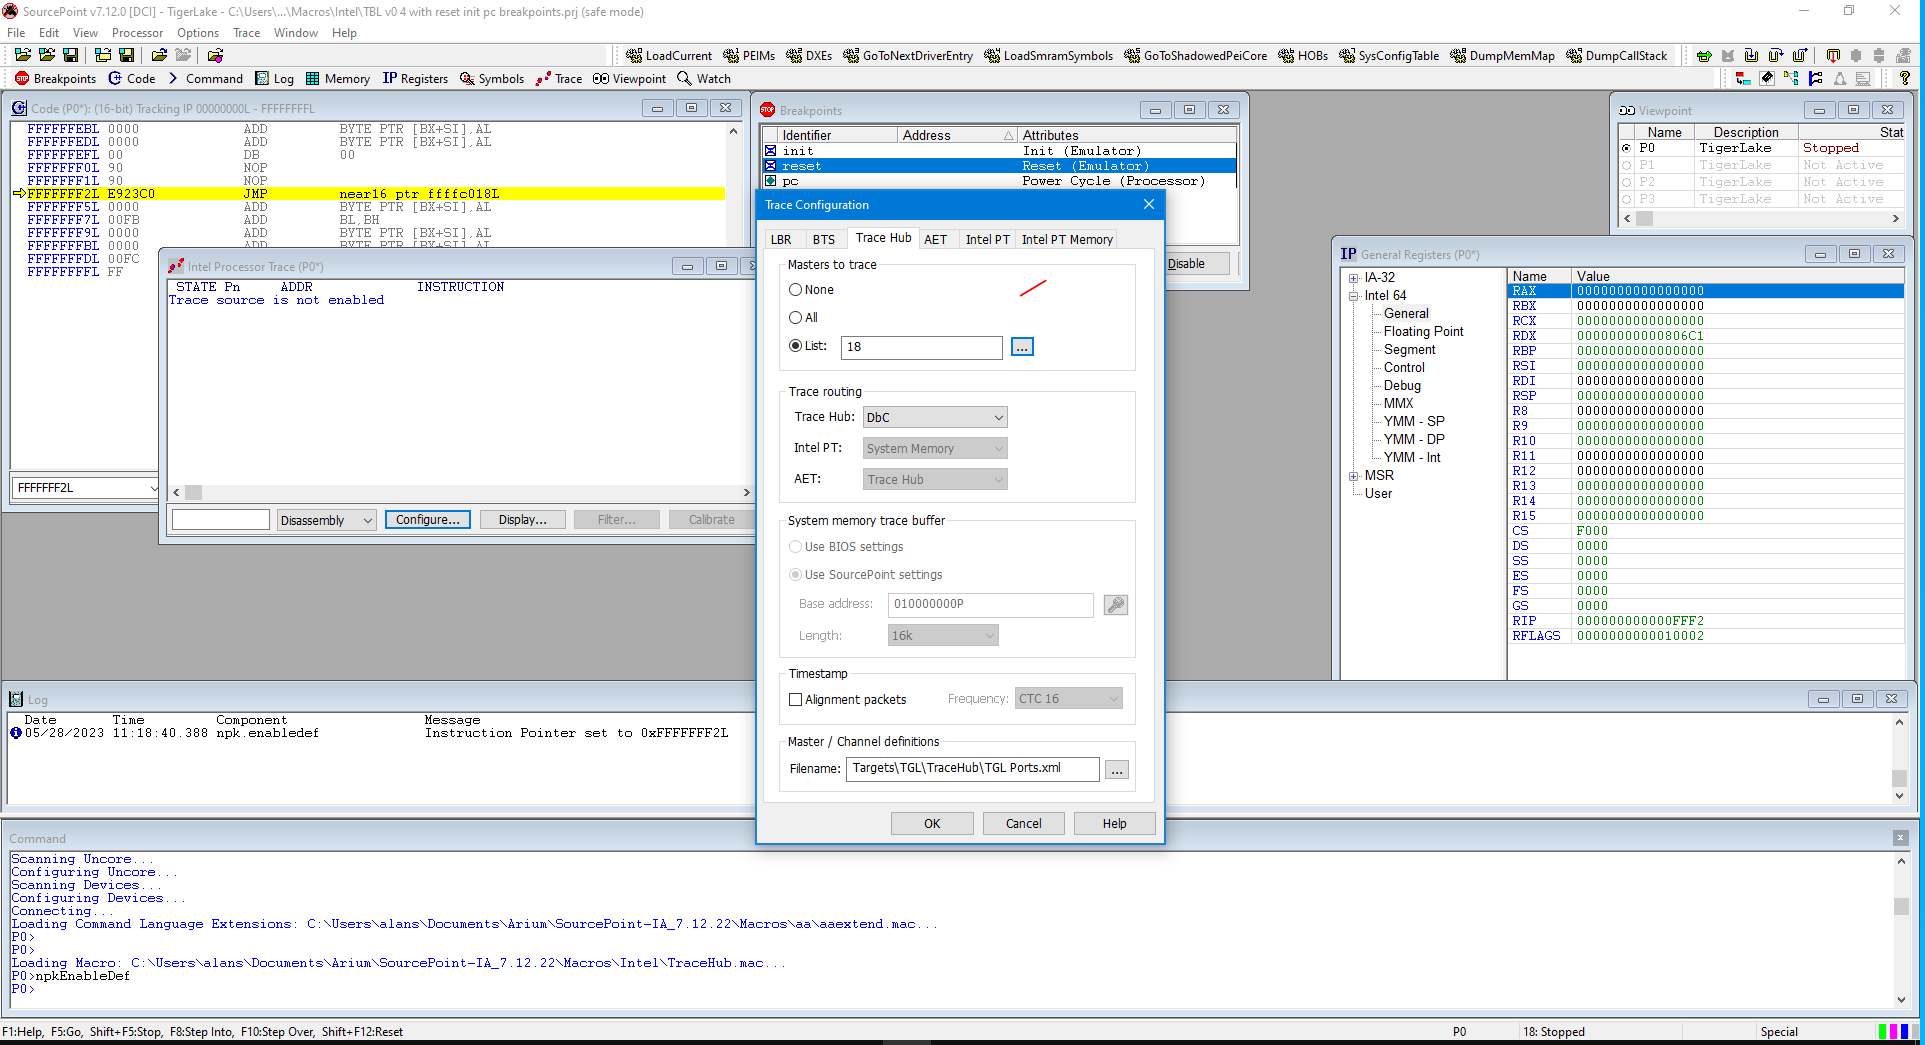
You can see that I’ve set up three breakpoints: Reset, Init and Power Cycle. This is necessary because in order to use the Intel Trace Hub to run AET, we need to power cycle the platform, and then configure it at the reset vector with the npkEnableDef macro (note that “npk” is short for “North Peak”, that was the early Intel codename for the Trace Hub); and then register AET Master 18 in the Trace Configuration window:
Then hit Go, and boot to Windows again.
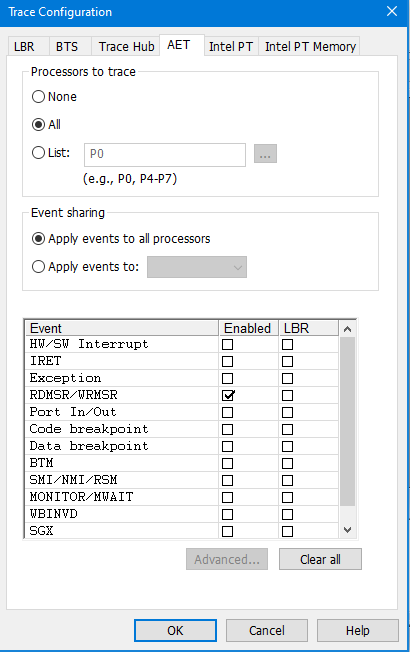
Then turn AET on in the AET tab of the Trace Configuration window, tracing all processors. In this instance, I’ll just trace MSR reads/writes:
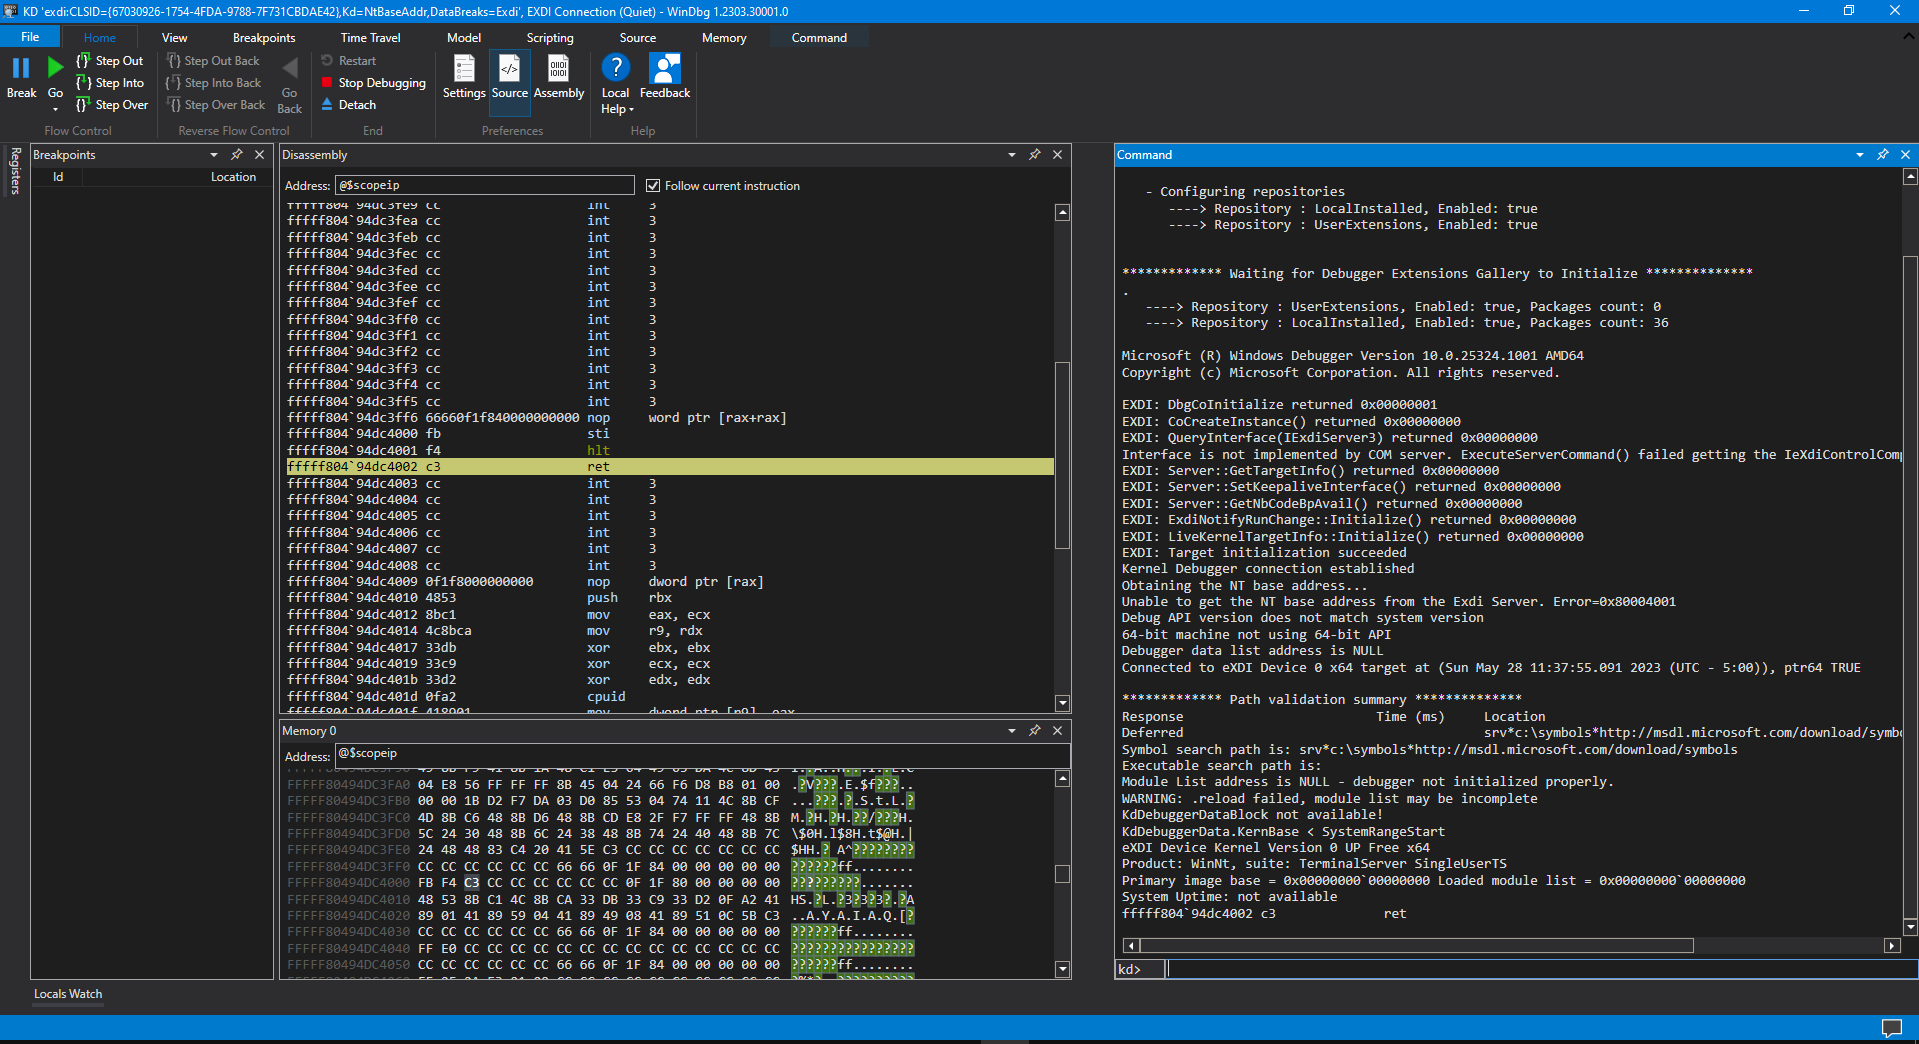
Then, I launch WinDbg to connect via EXDI to the target from a Command window:
C:\WinDbgEXDI>windbgx -v -kx exdi:CLSID={67030926-1754-4FDA-9788-7F731CBDAE42},Kd=NtBaseAddr,DataBreaks=Exdi
Then, side-by-side, you can see the WinDbg and SourcePoint windows:
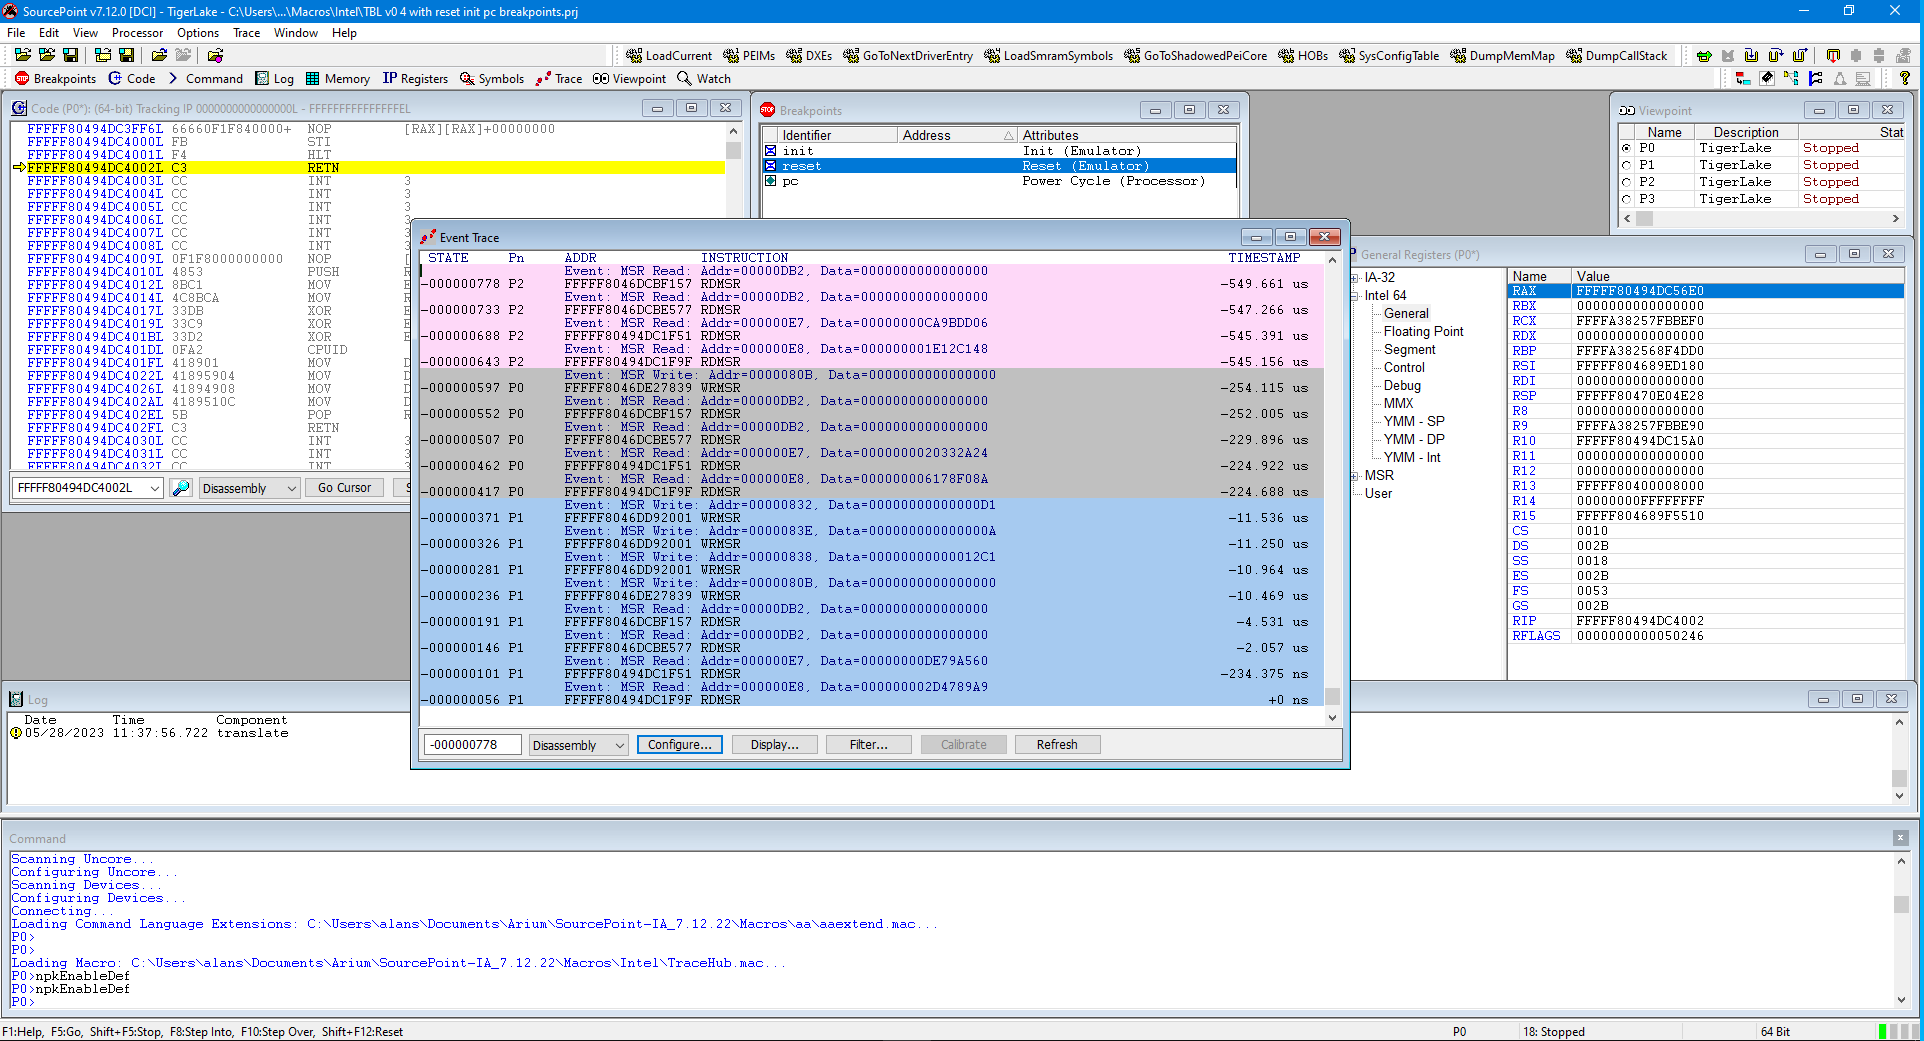
Note that timestamps are available. Pretty cool. And the reads/writes sequence we see comes from different CPU logical threads (P0, P1, P2 and P3).
The events go back many minutes, and we can really capture as much trace data as we want. Summarizing some of the MSRs on display, using the Intel Software Developers Manual (SDM) to document the MSRs themselves:
| MSR Address | MSR Read/Write | MSR Sample Data | MSR Name |
| E7 | Read | DE79A560 | IA32_MPERF |
| E8 | Read | 6178F08A | A32_APERF |
| DB2 | Read | 0 | IA32_THREAD_STALL |
| 80B | Write | 0 | IA32_X2APIC_EOI |
| 838 | Write | 12C1 | IA32_X2APIC_INIT_COUNT |
| 83E | Write | A | A32_X2APIC_DIV_CONF |
| 832 | Write | D1 | IA32_X2APIC_LVT_TIMER |
There’s lots of interesting information here. We can trace MSR reads/writes at any point in the boot cycle for UEFI and Windows, all the way from the reset vector, or as applications run on Windows. And by right-clicking at any read or write of interest, we can open up a Tracking Code window, that shows exactly where in the code it was invoked:
![]()
We can also correlate all of these events with Intel Processor Trace, all timestamped, and see the precise code flow for all events. I’ll write about this soon.
What else can we do with AET? Lots. We can capture events associated with HW/SW Interrupts, IRETs, Exceptions, Port In/Out, SMI/NMI/RSM, MONITOR/MWAIT, WBINVD and SGX. And most amazingly, we can treat a Code or Data Breakpoint as an event, capturing it but not actually halting the target at the time – which is actually a huge benefit to debugging, as we shall see in an upcoming blog.