
It’s probably not well-known, but AMD platforms have special low-level breakpoint capabilities that aren’t available on Intel platforms. They are extremely powerful; here’s how to use them.
Hardware breakpoints are well-known to those who use JTAG-based debuggers. Chapter 17 of the Intel Software Developers Manual covers the topic in detail. To summarize for the purposes here, Intel supports a maximum of four hardware debug breakpoints, one for each of debug registers 0 through 3 (DR0 – DR3). Hardware breakpoints have an advantage over software breakpoints in the context of being able to halt the target even when system memory is not available.
Further, hardware breakpoints rely on processor-specific registers to recognize events, such as instruction execution or data reads/writes at a memory or I/O address. Hardware breakpoints cause the processor to stop immediately; there is little or no “slide” for non-execution breaks (i.e., breaks occurring on Data Access, Data Write, and I/O Access break on types). Pre-fetched but unexecuted instructions do not cause the processor to stop. The code location of an execution breakpoint can be in ROM. Each processor (core or thread) has a maximum of four hardware breakpoints.
Software breakpoints, on the other hand, are implemented by placing a special instruction (such as a software interrupt) in memory. Software breakpoints cause the processor to stop immediately (there is no “slide”). Software breakpoints do not stop the processor on unexecuted pre-fetches. With SourcePoint, software breakpoints are limited to execution breaks. The location of the instruction to be executed must be writable (i.e., located in RAM). Code at the breakpoint location cannot be loaded or modified on the fly. Care must be taken to ensure breakpoints are set at the first byte of an instruction. As opposed to hardware breakpoints, the number of software breakpoints that can be set is virtually unlimited.
On x86, the hardware breakpoint types supported are:
Execute
Data Access
Data Write
I/O Access
In each case, an address is specified, and the platform halts when an instruction is executed at that address, or when data is written to that address, data is read from or written to that address, or an IN/OUT occurs to/from that address.
AMD supports the same hardware breakpoint types, but with a twist. These have been enhanced to provide more capability than what is available on Intel platforms, to allow for dependencies on address ranges, address masks, data values, etc. The three types of these “conditional” or advanced breakpoints are:
- Don’t Cares are now allowed in breakpoint addresses. This applies to all of the above breakpoint types.
- An address range can be specified. Rather than breaking on a specific address, you can break when any address in a range occurs. Note that this only applies to data breakpoints.
- A data value can be associated with a Data Write or Data Access breakpoint, so that a break only occurs when that value is written, or the subject of a read or write.
These new features enhance the debugging experience significantly. When used with some forethought, these new breakpoints can greatly assist with bug-hunting and the detection of rogue code.
Let’s look at a few short simple examples to see how these work.
For illustrative purposes, we’ll use the SourcePoint macro language to create a little example program in assembler. In this case, the program moves 1100 into the ECX register, and then thus places the value 55 at address 1100, then jumps back to itself:
asm 1000 =

     mov ecx, 1100

     mov [ecx], 55

     jmp 1000

endasm
- BREAKPOINT WITH INSTRUCTION EXECUTION MASK
We load the above macro in, and then set up an instruction “Execute” breakpoint at the x’1000 location, clicking on the mask button 1010… to set up the 1s, 0s and Xs: the latter being the mask “Don’t Cares”. In this case, we have the last nibble be X10X:
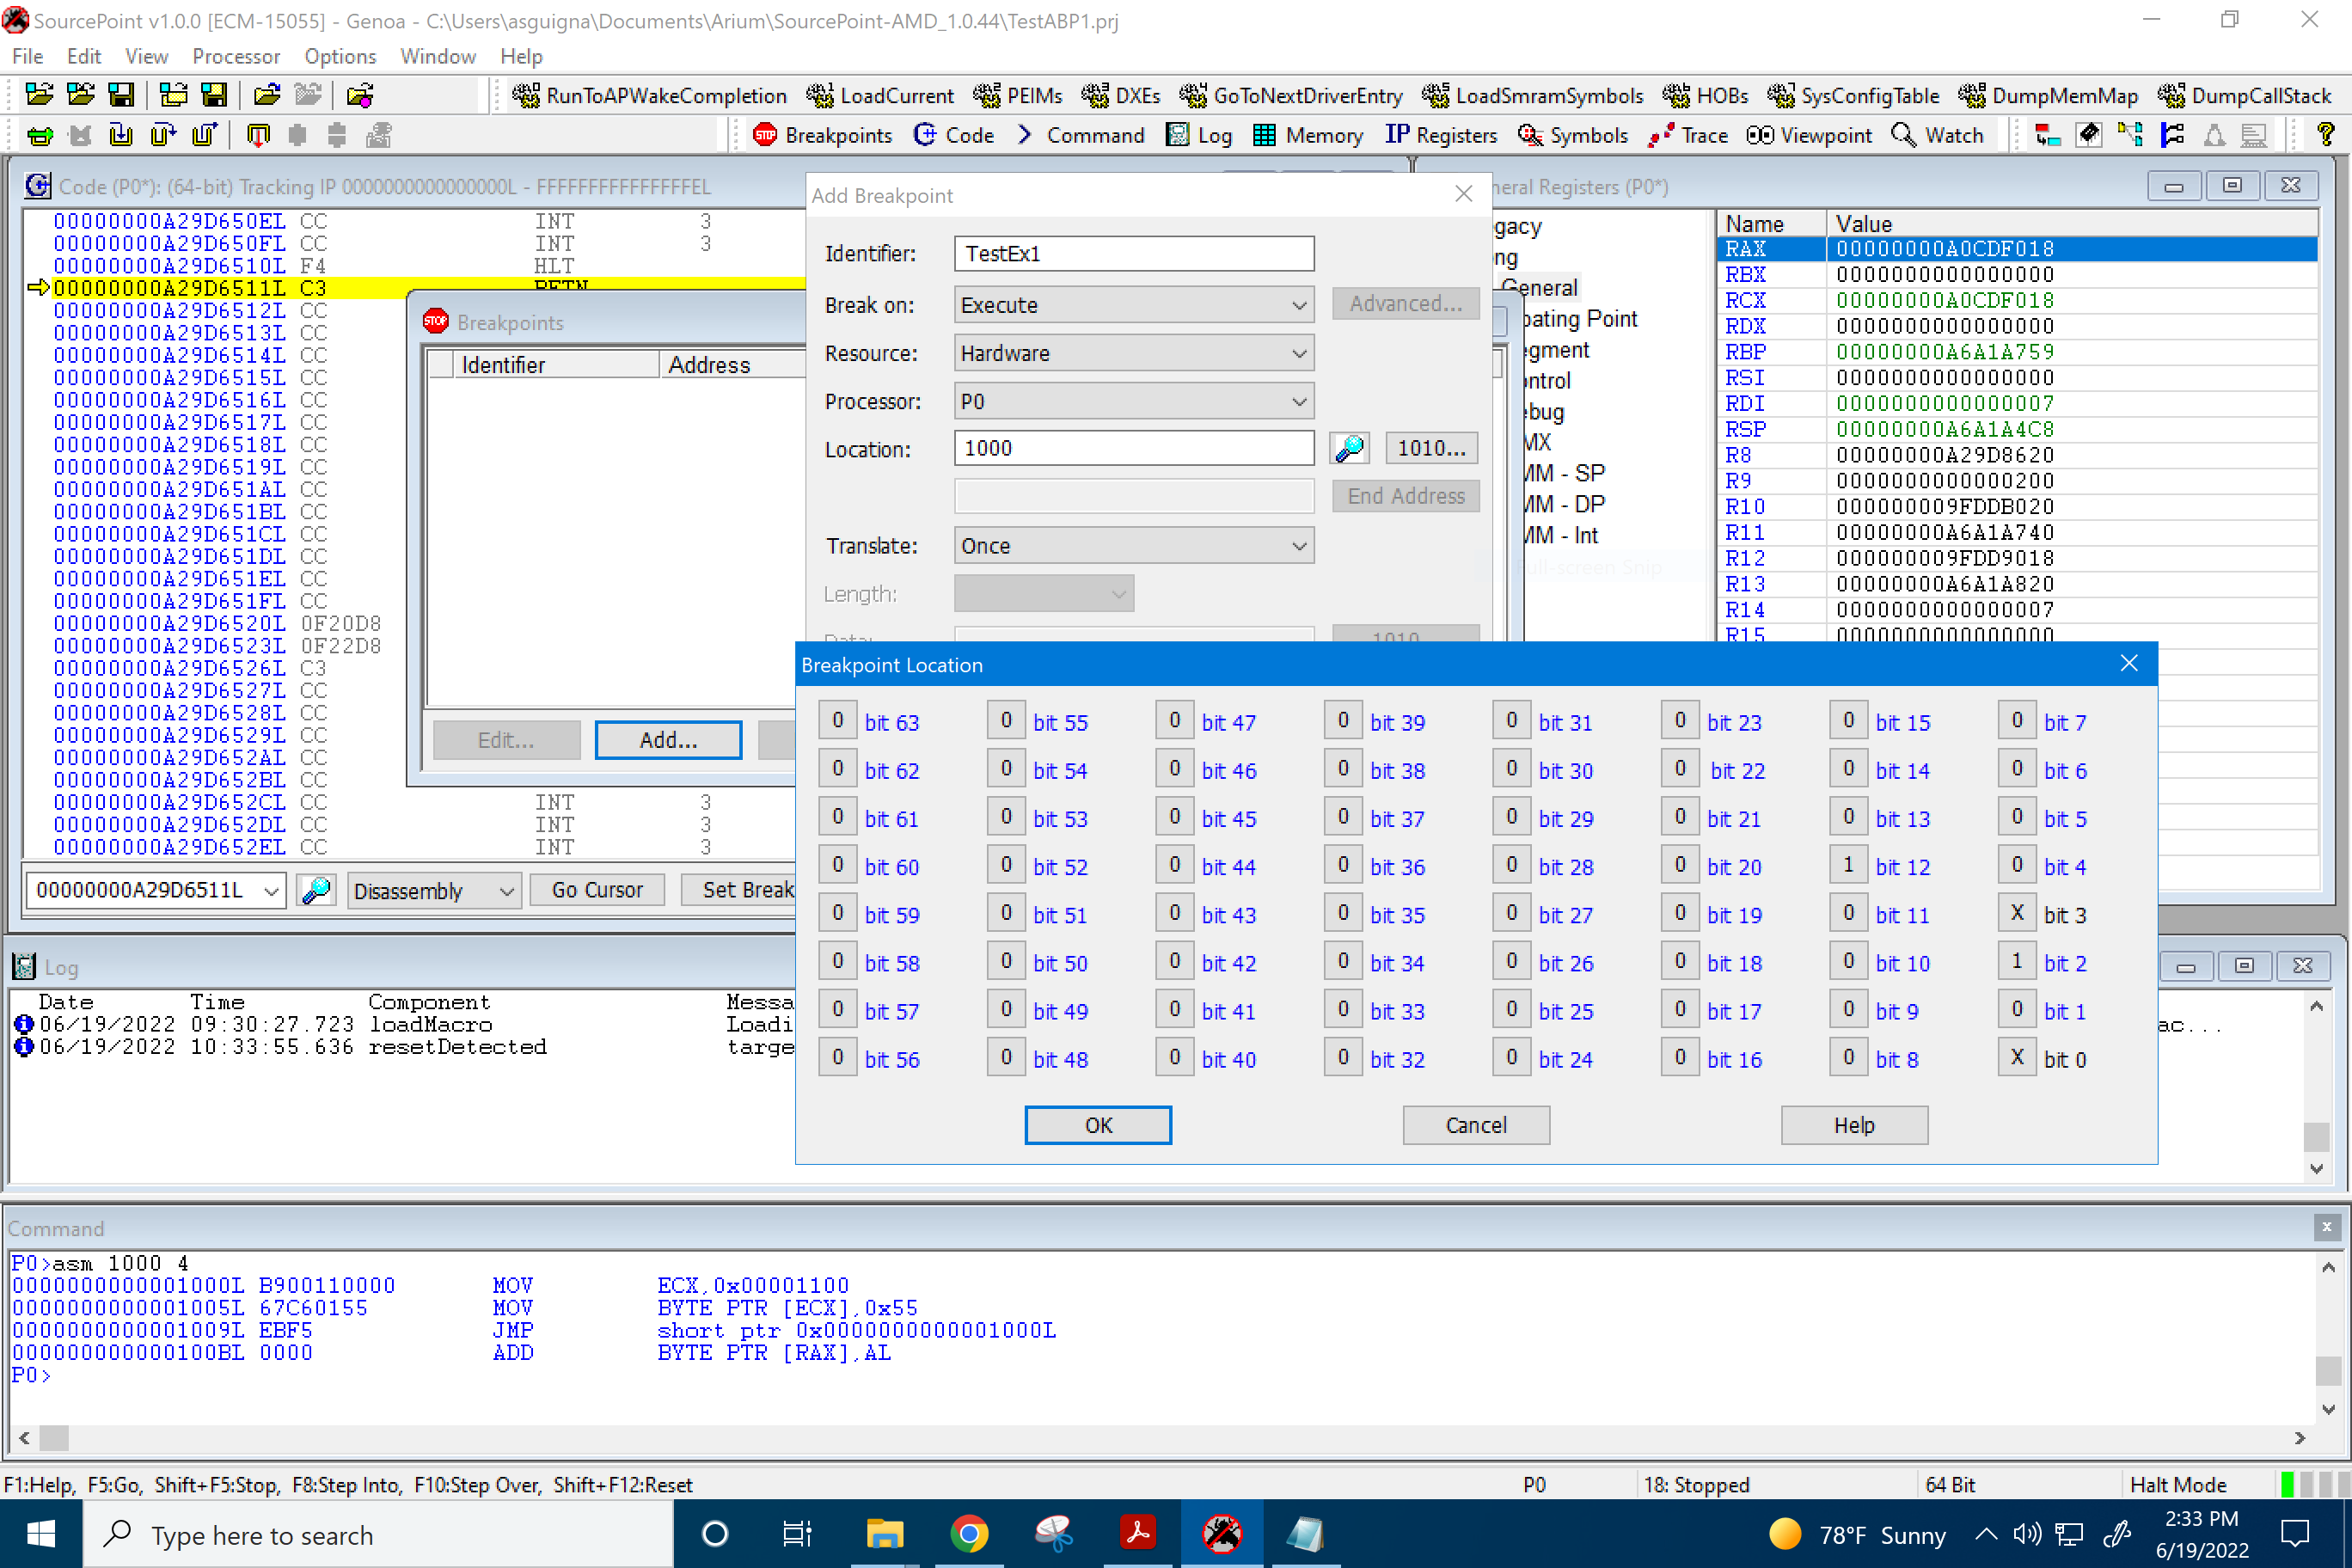
When we look at the program, it runs from 1000L through 100AL, with the last instruction beginning at 1009L:
![]()
Or, in binary form, the last nibble of the three instructions’ starting addresses (x’0, x’5, and x’9 respectively) are:
0000
0101
1001
So, with a bitmask of X10X, the break should only be hit at address 1005L – only the x’5, or binary 0101, passes through the X10X mask – which is in fact what we observe.
- BREAKPOINT ON DATA ACCESS WITHIN AN ADDRESS RANGE
We can select a Data Access breakpoint and specify a Begin Address and End Address (in this case, 1100L and 1200L) to break in. In this case, since we did the MOV [ECX], 55, we are moving x’55 into address 1100L, so we should indeed break at that instruction:
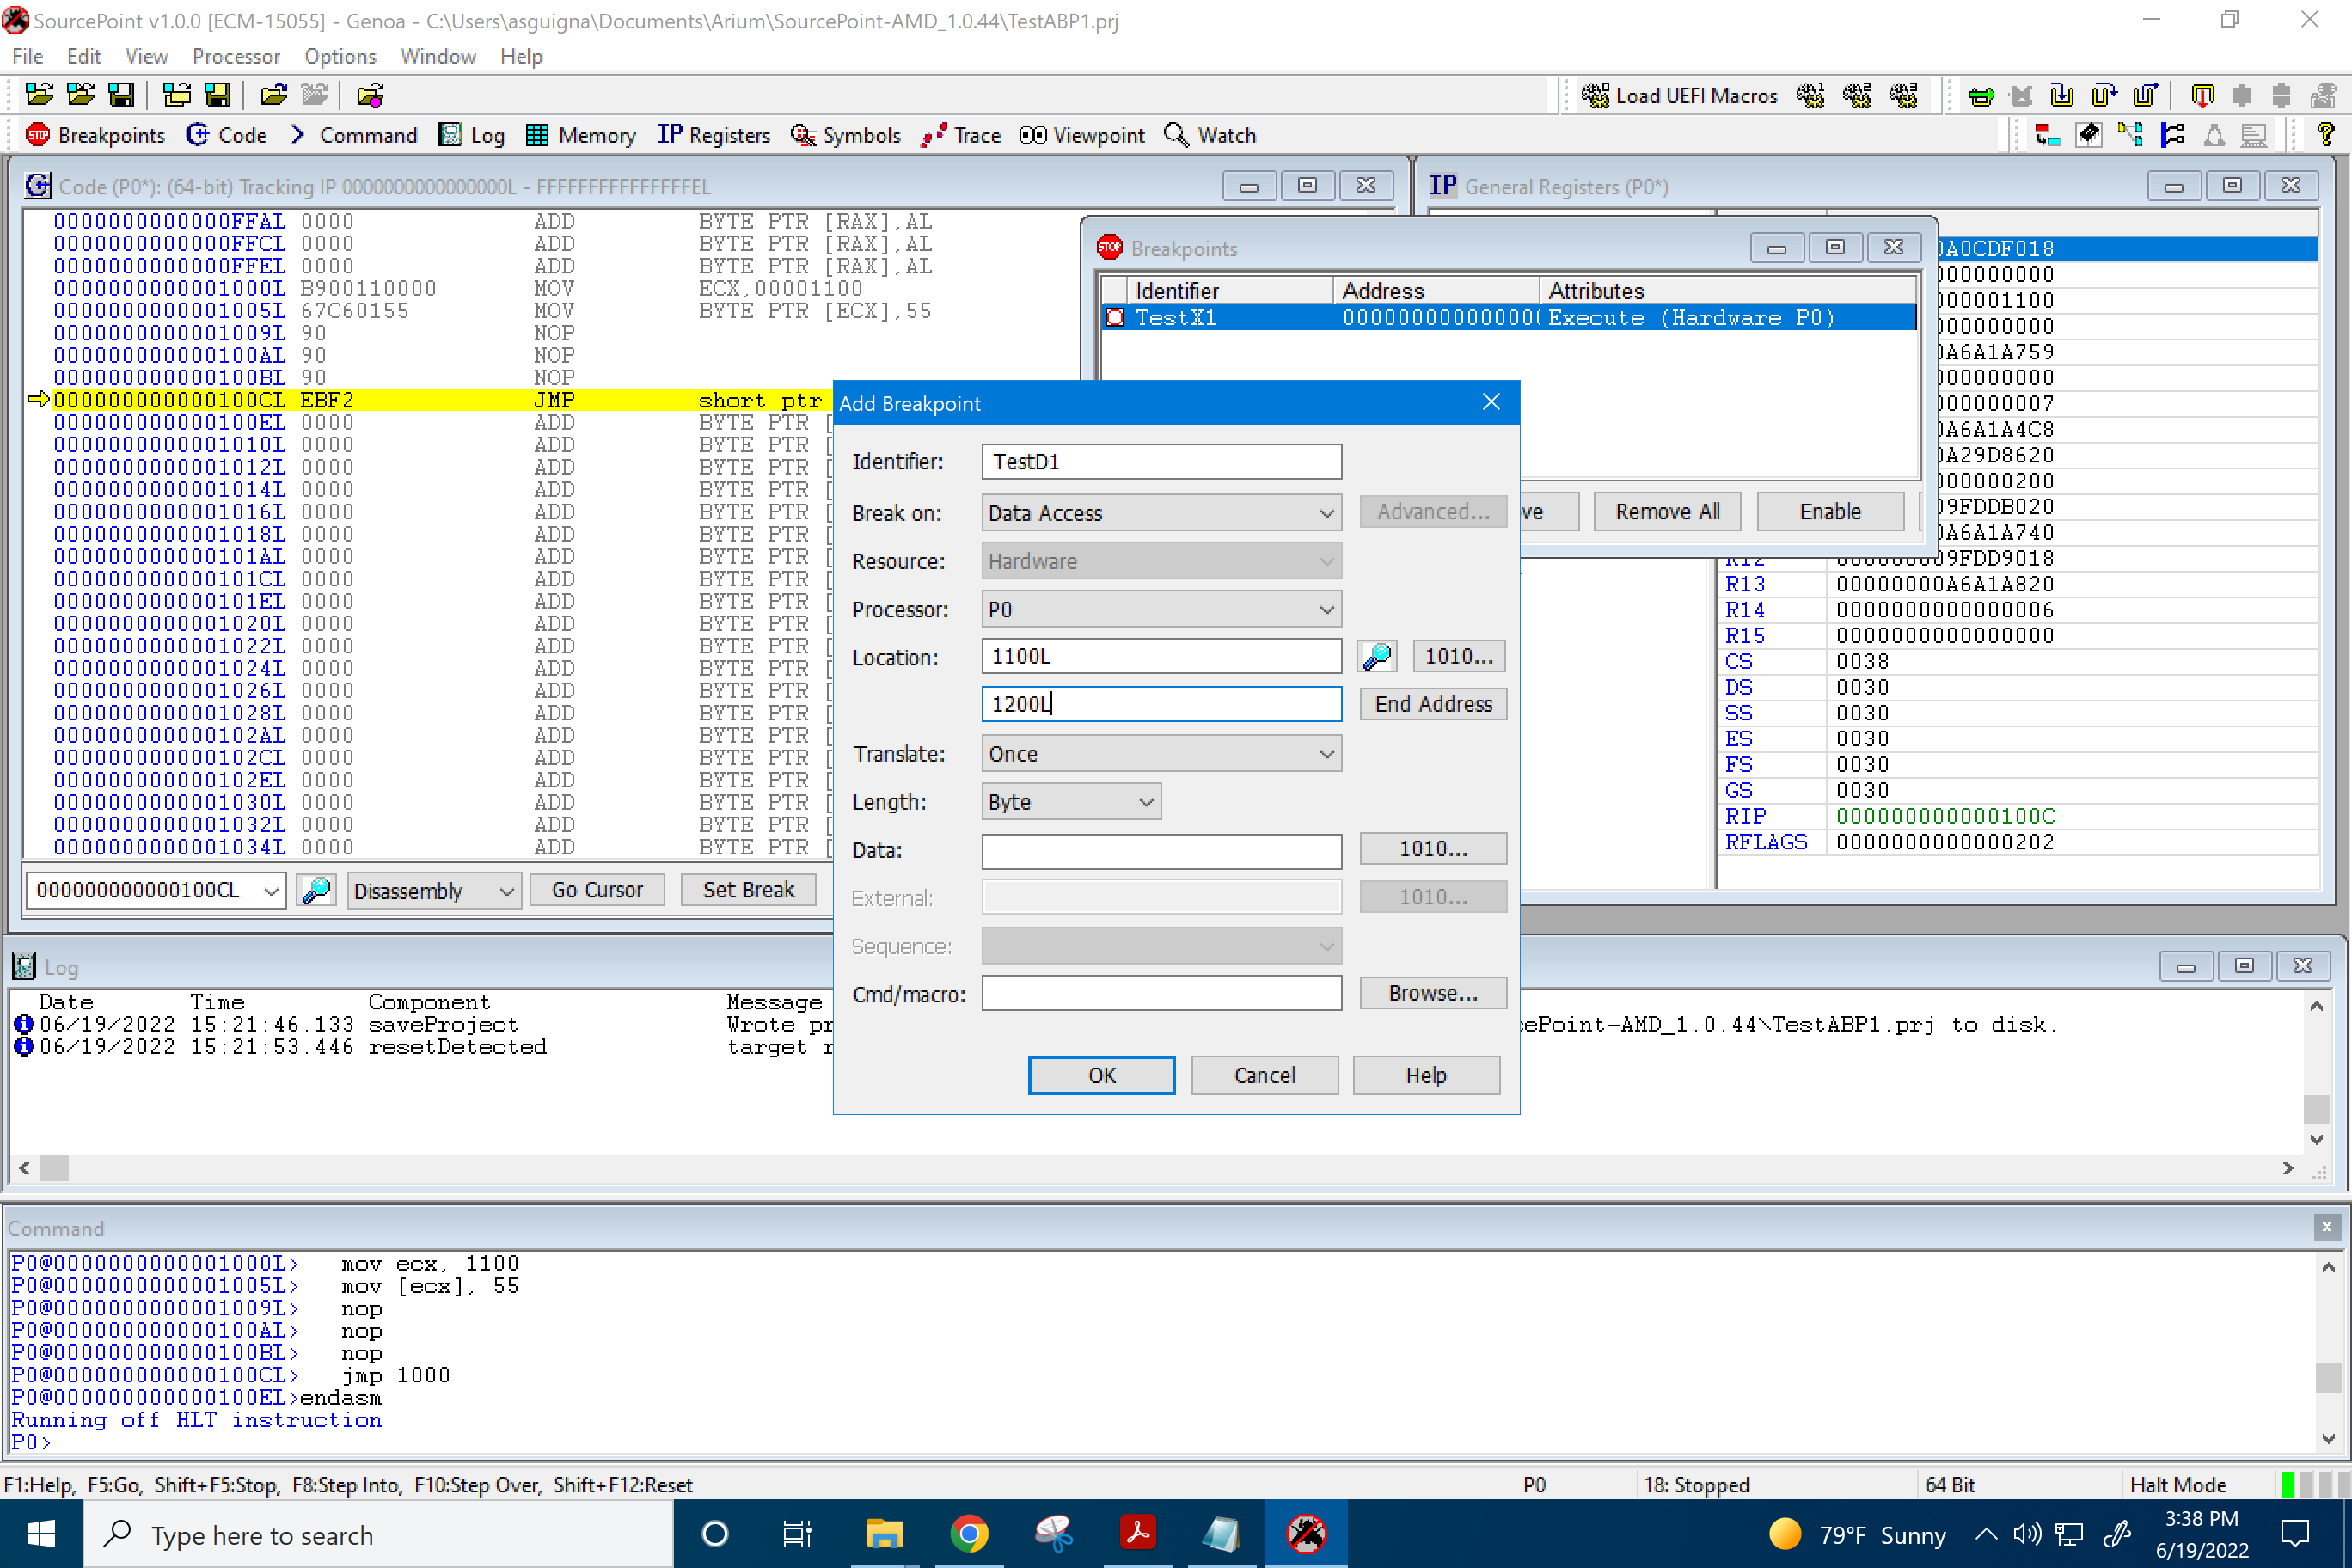
Note that I’ve added a few NOPs after the second MOV instruction, just to visually separate the data move instruction from the JMP instruction.
And that is what we see, but with some “skid”. We actually break one instruction after the MOV [ECX], 55:
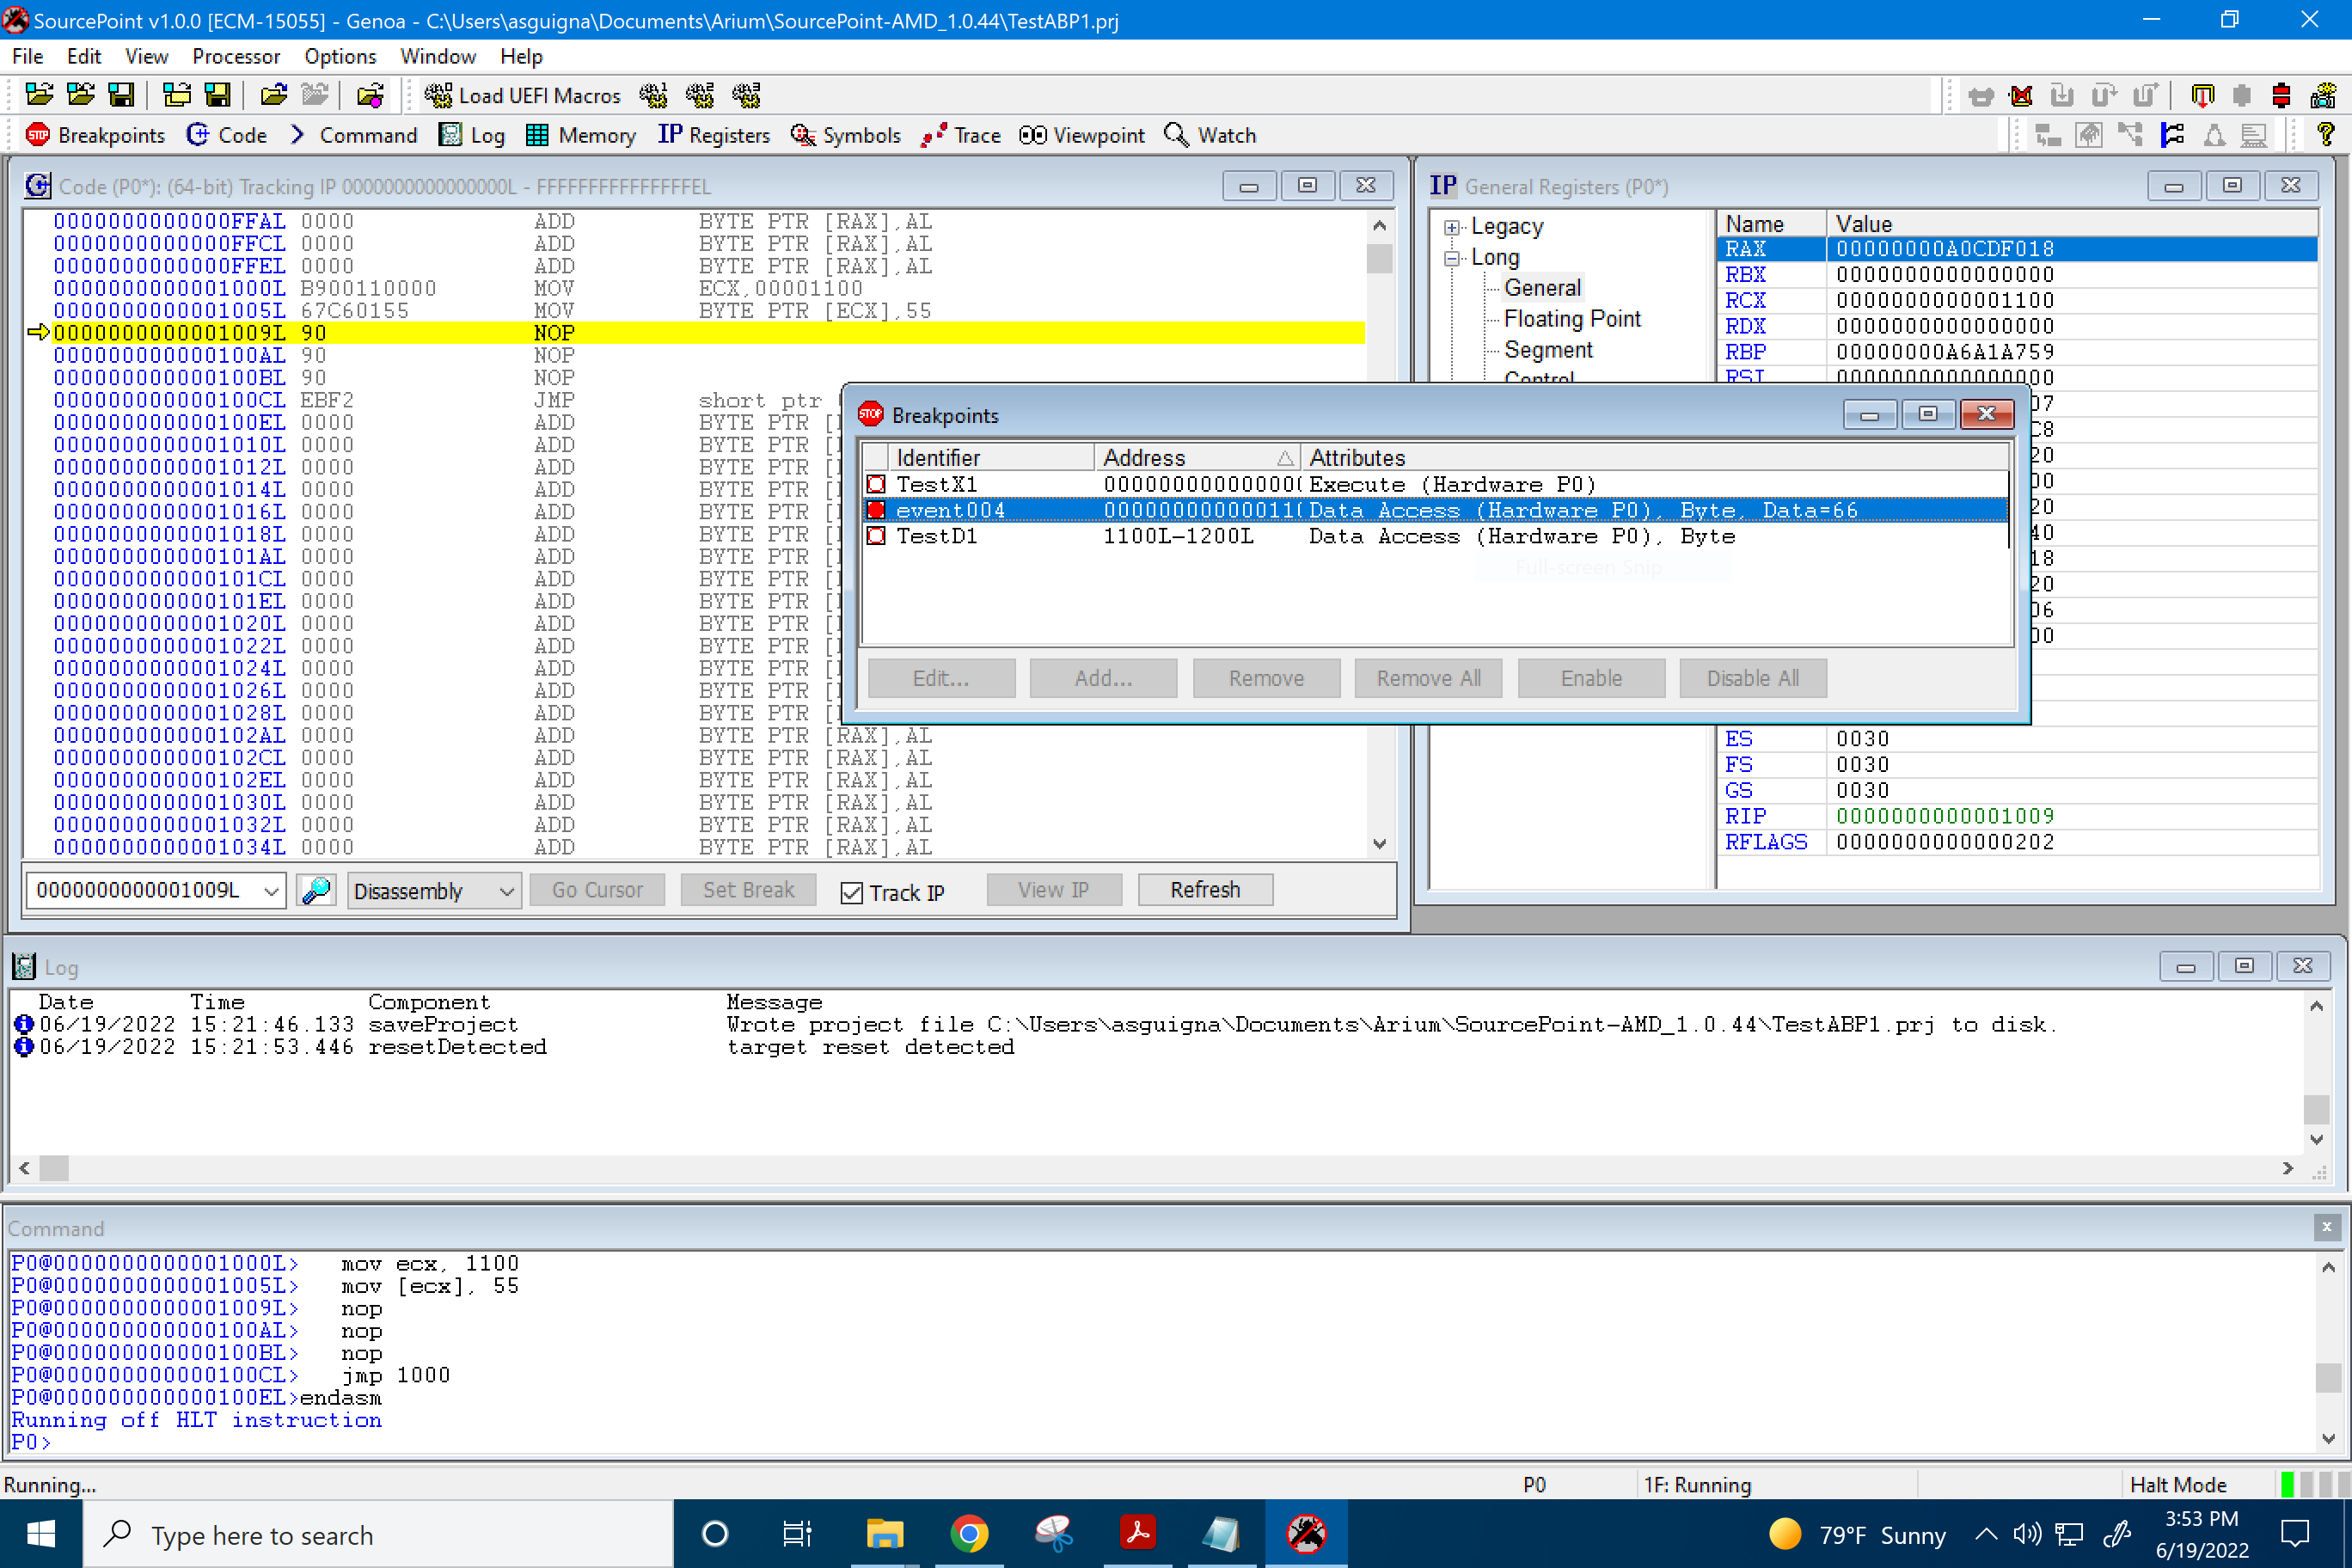
This is as expected, as documented in the Intel Software Developers Manual (SDM), Section 17.3.1.2:
Data memory and I/O breakpoints are reported when the processor attempts to access a memory or I/O address specified in a breakpoint-address register (DR0 through DR3) that has been set up to detect data or I/O accesses (R/W flag is set to 1, 2, or 3). The processor generates the exception after it executes the instruction that made the access, so these breakpoint condition causes a trap-class exception to be generated.
Pretty cool, huh?
I’ll write about some more examples shortly, and provide some practical tips on how to use these advanced breakpoints in real-life debugging scenarios. In the meantime, happy AMD debugging!