
Our new SourcePoint Intel release, 7.12.22, is now in production and available to all subscribers. Our most polished, fully-featured release yet, it adds the following features:
UEFI macro enhancements for GCC compiler
Many of our customers use Windows build machines to create UEFI images for their development. Over time, there’s been a trend to move to Linux hosts, and instead of Microsoft Visual Studio, gcc and clang are the compilers of choice here.
Symbol files for these are in a different format, so the SourcePoint “LoadThis” command needs to support them. Further, our UEFI macros, that allow for loading of all PEI and DXE modules source and symbols into the SourcePoint with the touch of a button, can now instantly distinguish between MSVC and gcc build environments, and load the appropriate files.
Sapphire Rapids SKU and Steppings support
As Sapphire Rapids rolls through to production silicon, Intel releases new steppings to fix things. Also, there are new SKUs made available for different markets, for example an HBM version of the CPU. SourcePoint keeps up with all the latest SKUs and steppings in case there are minor changes to run-control and trace somewhere in the silicon, microcode or BIOS support code.
VMExit and VMLaunch hypervisor breakpoint support
This is a feature that we’re really proud of. Hypervisor technologies are extremely complex, and are being adopted in many new areas, particularly where code is needed to protect OS kernels from cyberattacks.
This feature adds the ability to set breakpoints that halt the system during a virtual machine launch (that is, a guest OS being entered) and exit (with the capability to break solely on a particular Basic Exit Reason, or even a number of Reasons). See the Intel Software Developers Manual, Appendix C of Volume 3, VMX Basic Exit Reasons.
Want to know more? Check out the following articles that present valuable “How To” information:
Debugging Type 1 Hypervisors on the UP Xtreme i11 using JTAG/DCI
SourcePoint Hobbyist Update, and Hypervisor Course Review
Using JTAG for Hypervisor Debug: Part 3
And the webinar, DCI debug of UEFI and hypervisor technologies on the AAEON UP Whiskey Lake and Tiger Lake boards, has a demonstration of hypervisor debug using these facilities, roughly 46 minutes in.
Alder Lake support
Alder Lake, or 12th Generation Intel Core CPU, is Intel’s first foray into the “big.little” heterogeneous architecture: that is, it has a number of Performance (Core) processors, and Efficiency (Atom) processors. The ratio can vary by SKU. SourcePoint now supports all possible heterogeneous configurations.
Enhancement to bitfield display for structures with union
This was actually a bug that we discovered when adding our hypervisor support. For example, when using UNION in the below:
 typedef union _VMEXIT_INTERRUPT_INFO
 {
     struct
     {
         UINT32 Vector : 8;
         UINT32 InterruptionType : 3;
         UINT32 ErrorCodeValid : 1;
         UINT32 NmiUnblocking : 1;
         UINT32 Reserved : 18;
         UINT32 Valid : 1;
     };
     UINT32 Flags;
 } VMEXIT_INTERRUPT_INFO, *PVMEXIT_INTERRUPT_INFO;
We found that we were not honoring and displaying the bitfield structures correctly. This has been fixed.
Rocket Lake DCI support
This is pretty self-explanatory. Prior to this release, it was only possible to debug Rocket Lake-based platforms using the XDP interface (and, therefore, incur the cost of the ECM-XDP3e hardware probe). Now, debug can be done via the specialty USB cable and DCI.
Raptor Lake support
Ditto. This is Intel’s 13th Generation Core. More cores, more performance, etc. Like Alder Lake, but on steroids.
Enhanced support for AET with LBR
Architectural Event Trace (AET) is one of my favorite debugging capabilities on Intel platforms. Unlike breakpoints (that stop the target) and execution trace (that captures the instruction flow), Event Trace captures information on specific events without halting the target.
Think about that for a minute. Here are some events that can be captured:
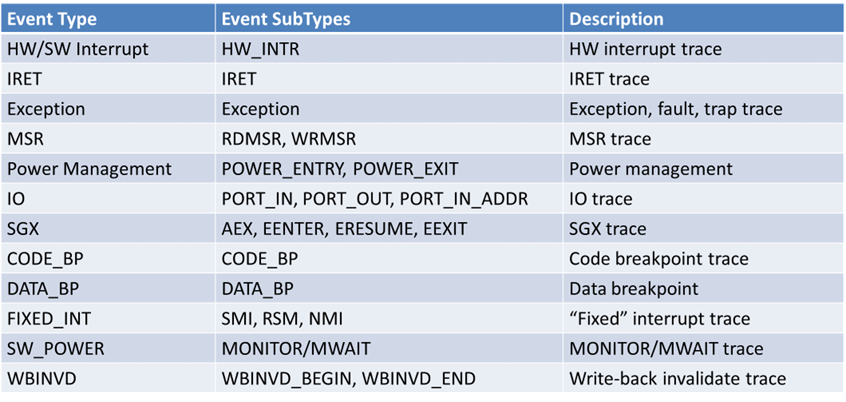
The CODE_BP and DATA_BP features are the best, in my opinion. Say you want to capture some code being executed, or a write to a data address, but you don’t want to break when the write is done; you want the code to continue to flow, and examine the occurrence later, so as to capture the corrupting code in action. This requires micro-architecturally changing the behavior of a hardware breakpoint in the Intel silicon, which AET allows us to do.
A great demonstration (okay, I’m a little immodest here) of AET can be seen in the UEFI Forum webinar, UEFI Debug with Intel Architectural Event Trace.
AET thus offers unprecedented information into the codebase, especially when used with instruction trace. And since Intel Processor Trace uses system memory to capture the instruction flow, on previous generations you could only use AET with instruction trace after the memory is initialized – that is, well into DXE. Now, using AET with Last Branch Record (LBR) trace, you can capture a few hundred instructions prior to each event, and right from system reset.
And Intel made some architectural changes to LBR handling that needed our attention in this release.
Peek Memory feature
This allows the reading of 32 bits of data using a register as a memory address. This is a perfective enhancement that’s very useful when working with pointers stored in registers.
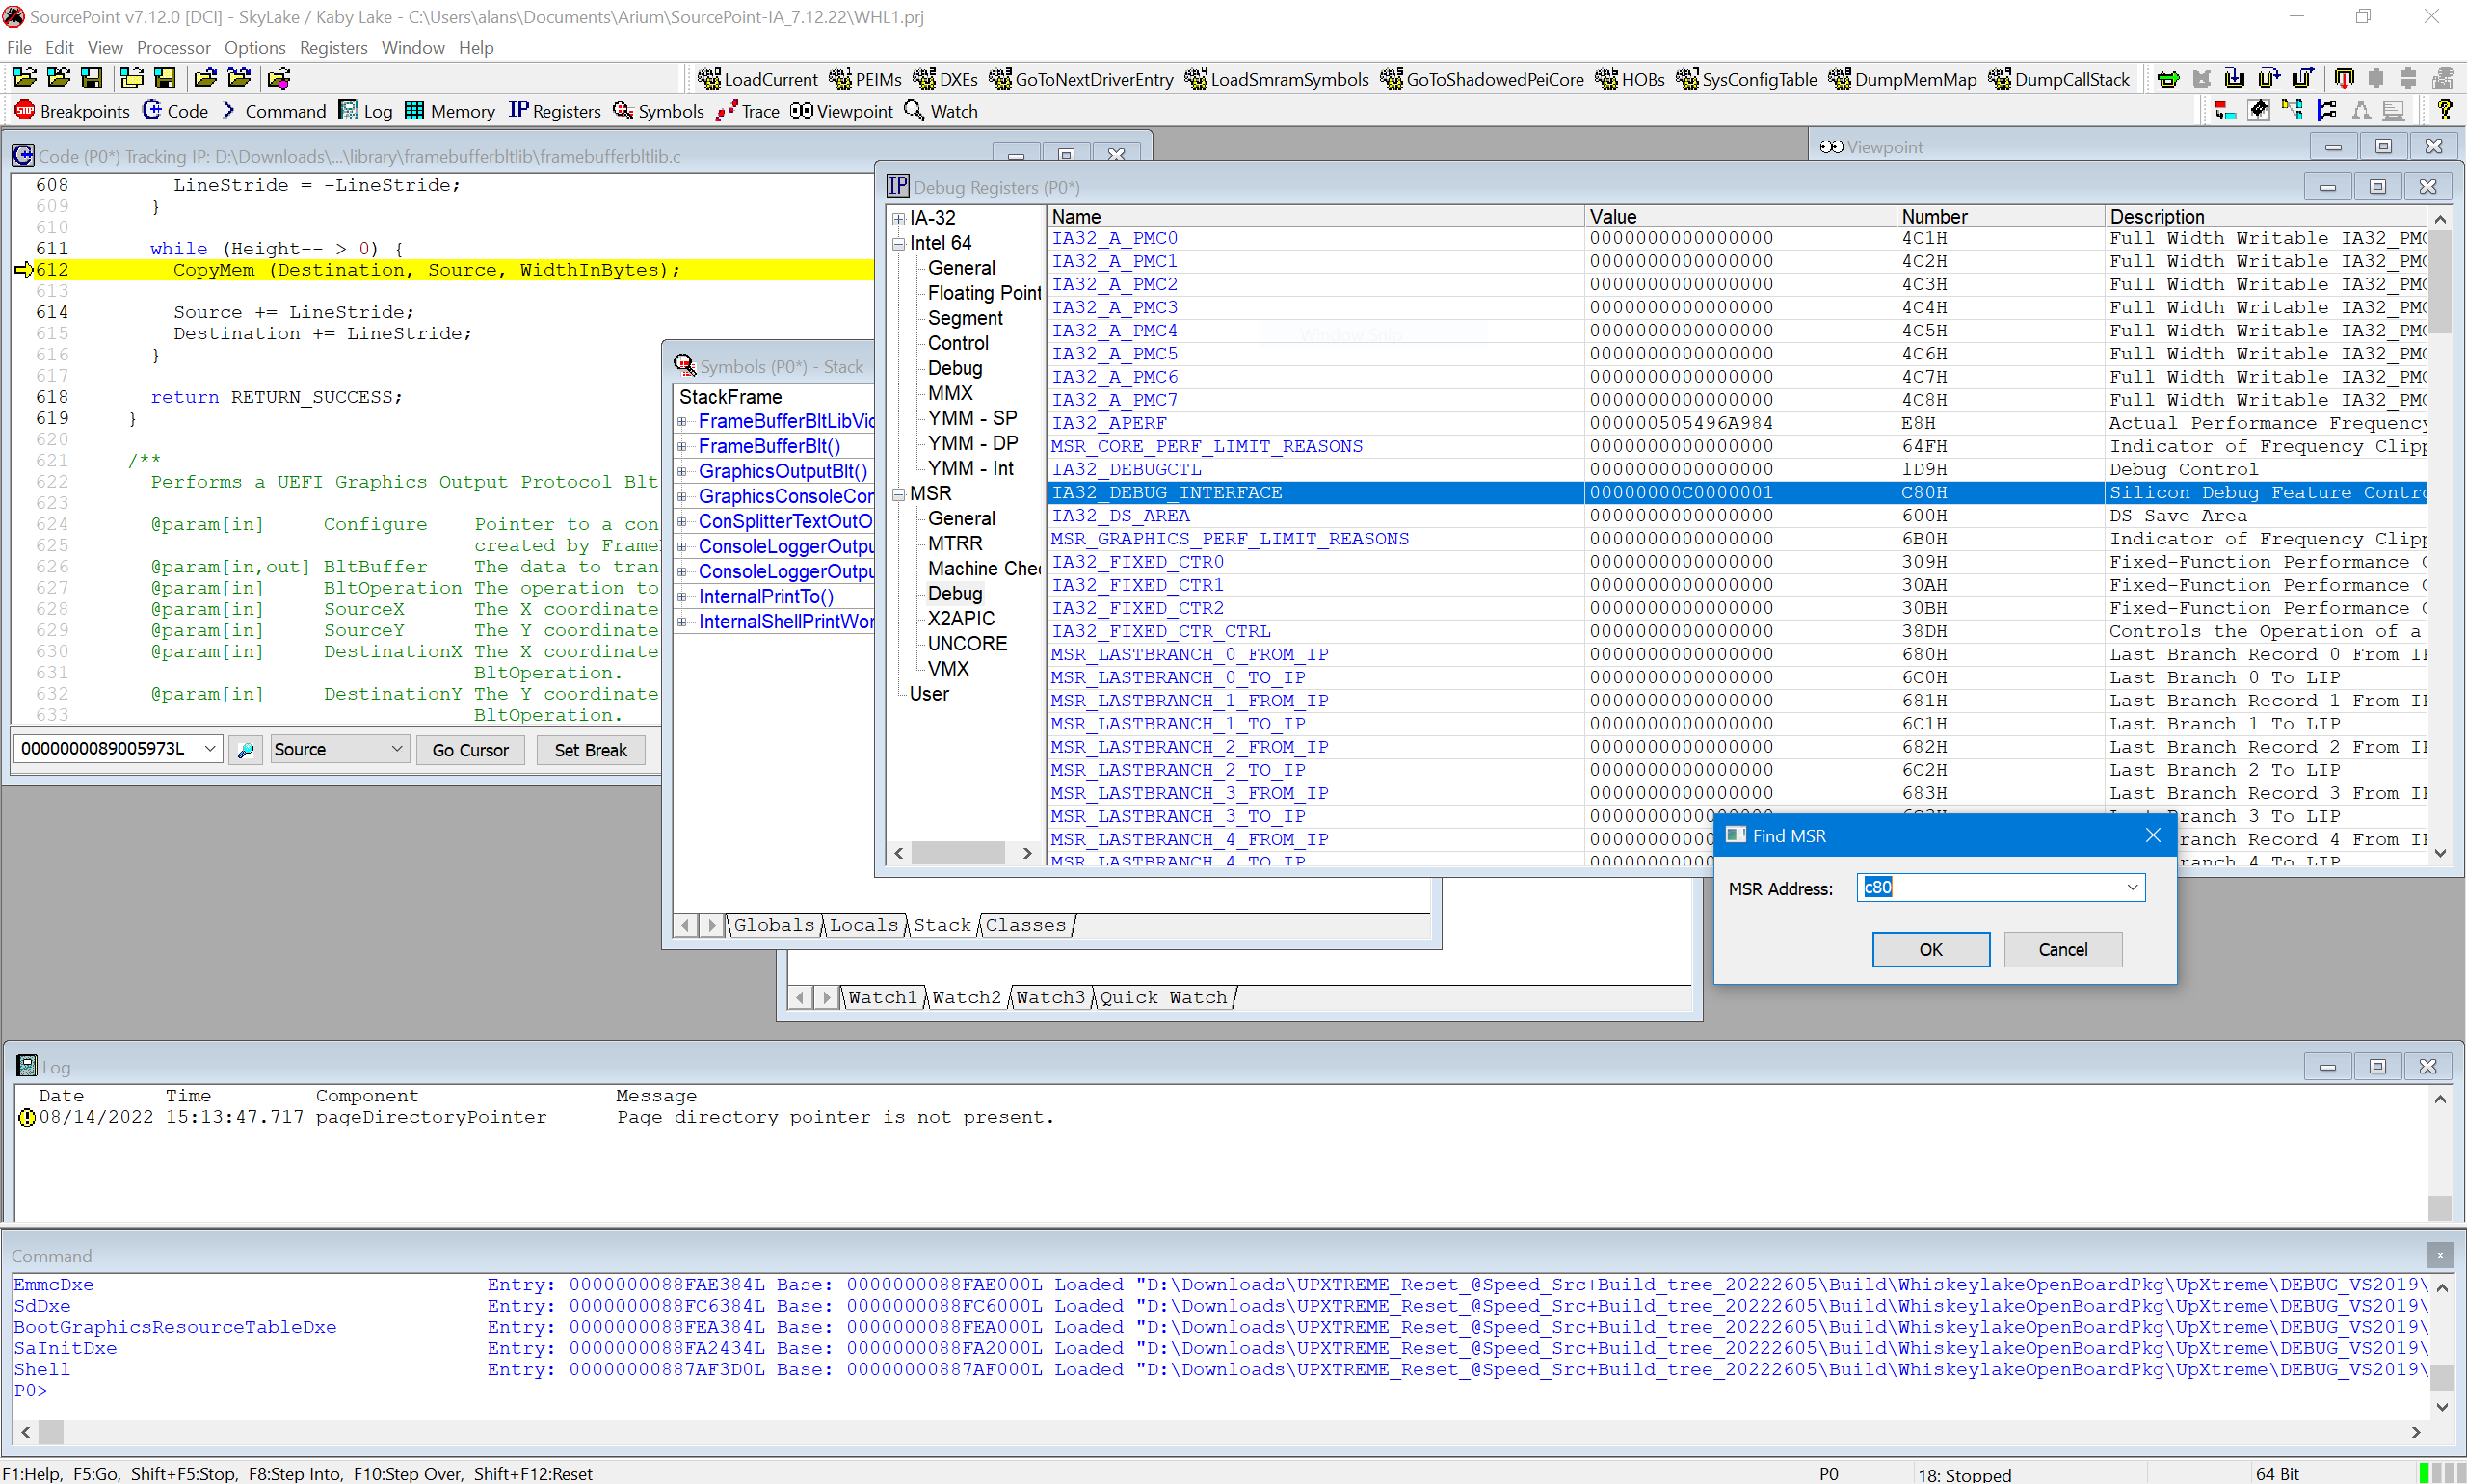
Find MSR feature
Search the Register view for an MSR by number. In the Registers windows, select MSR, and then right-click to Find MSR and type in the address you’re interested in.
Want to see a little more detail, and see the history of the SourcePoint releases going back to the dawn of time? Check out our public Release Notes.