
In my last article, SourcePoint Hobbyist Update, and Hypervisor Course Review, I did a quick overview of the getting started materials for the UEFI-based Type 1 hypervisor used in Satoshi Tanda’s course. This week, I delved into the code, using our JTAG debugger to set breakpoints, single-step through the code, watch the value of key variables, and trace the overall program flow.
In Part 1, Debugging Type 1 Hypervisors on the UP Xtreme i11 using JTAG/DCI, I used Intel Processor Trace to capture four milliseconds of hypervisor instruction trace data, which turned out to be exactly 1,901,598 assembly language lines of code. It was cool to see the direct invocation of the VMM instructions, such as VMRESUME, VMREAD, VMWRITE, ENDBR64, and others. And in Part 2, SourcePoint Hobbyist Update, and Hypervisor Course Review, I gave some background on setting up the build host to compile Satoshi’s MiniVisorDxe hypervisor.
It was time to get a little more serious, and use the SourcePoint tool to debug and trace the hypervisor code. And I wanted to run on real hardware, as opposed to the virtual machine environment presented in the course. There’s nothing as good as a JTAG-based debugger to see the code source and symbols, single-step through the programs, see variables changing in value, and trace its flow. As a learning tool, it’s extremely valuable. And that’s the whole point here: using the tools at your disposal to learn more, to the benefit of all. If you crave to learn more about getting your own copy, go here: New lower-cost versions of SourcePoint for hobbyists and researchers.
The first thing to do was to install Windows on my Tiger Lake UP Xtreme i11 board. I wrote about this process in my blog The UP Squared Chronicles Episode 5: Installing and Debugging Windows 10, and it’s pretty much the same steps for the UP Xtreme i11. A note to those who may be following in my steps: after you finish installing Windows, you do want to remove the USB stick with the installer. If you’re like me, and don’t install Windows very often, you’ll forget to remove the stick; in which case, you’ll go back into the installer, again and again, until your memory is triggered.
So, once you get past the install, you’ll have a fully functioning version of Windows 10 on the UP Xtreme i11 i3 board. The i3 board (don’t get confused between the i11 and i3 suffixes; i11 refers to the fact that the board uses a Tiger Lake Intel 11th Generation Core CPU; i3 refers the CPU SKU, a dual-core, four-thread machine) actually is quite high-performance; in the past, when I’ve done this on the Bay Trail-based MinnowBoard, and the Apollo Lake-based UP Squared board, Windows was very slow. The Tiger Lake board performs just like a regular PC. I’ll be able to use it for other purposes.
Use the F7 key to keep it from booting into Windows, so you can get into the UEFI shell. The MiniVisor hypervisor runs on top of UEFI. You can do some basic things in “demo mode” with the hypervisor in the shell. In its full-fledged form, it can run Windows. That’s where it gets really exciting.
Satoshi provides numerous exercises in the course, that build upon the teaching sections. It’s quite a hands-on course, which is a great way to learn. After an introduction to the underlying technology, we played with the hypervisor in its most simple form, seeing it capturing privileged instructions such as RDMSR and a MOV from CR. Then, as the course progresses, the hypervisor gets more powerful, ultimately handling full multi-core Windows and Linux boot, with support for extended page tables, multiprocessor support, CR shadowing, etc. etc.
The main application we use is ShellApp.efi, an EFI module that loads the MiniVisorDxe hypervisor, supporting the below arguments:
crs

cpuid <leaf> <subleaf>

hypervisor

load <hypervisor_efi_file>

mtrr <address_to_lookup>

protect

rdmsr <msr>

v2p <cr3_value> <address_to_translate>

gp2p <eptp_value> <address_to_translate>
The code to run these is worth looking at, in and of itself. For today, I decided to look at the “load” command.
“load” loads in the MiniVisorDxe.efi hypervisor. I do know that, based on the MODULE_TYPE definition within the INF file, there are different types of modules:
UEFI_APPLICATION                       Is unloaded when it returns.

DXE_DRIVER                                  Remains loaded until the Runtime (RT) stage of UEFI

DXE_RUNTIME_DRIVER               Remains loaded indefinitely
In MiniVisorDxe.inf, our hypervisor is defined as a DXE_RUNTIME_DRIVER. But, Satoshi suggests in the course that the MiniVisor does not behave like any of the above, but is loaded by a custom loader. I wanted to explore this.
To watch the operation of the hypervisor code, on real hardware, there are a few things you can do without SourcePoint. Printf is always available, but there’s no graceful exception handling in this environment. And the course demonstrates some debugging capability using GDB under VSCode. But with SourcePoint, I have much more freedom. For starters, I simply put a deadloop at the entry point of ShellApp.efi, and then watched the code being executed based on commands issued.
One thing that I should mention here is that I compiled the hypervisor with VSCode running on WSL. Thus, the symbol information is embedded in the DLL file (amongst other places) output during the build process by GCC, as opposed to in PDB files produced by Visual Studio or VSCode.
Typing in:
ShellApp.efi load MiniVisorDxe.efi
Locks up the screen because of the deadloop in the code. See below:
INTN
EFIAPI
ShellAppMain (
    IN UINTN Argc,
    IN CHAR16** Argv
    )
{
    EFI_STATUS status;
    CONST CHAR16* command;
    //
    // This is the most reliable and useful "break point" in UEFI programming.
    //
    CpuDeadLoop();
    for (UINTN i = 0; i < Argc; ++i)
    {
        DEBUG((DEBUG_VERBOSE, "Arg[%d] = %s\n", i, Argv[i]));
    }
    if (Argc == 1)
    {
        ShowUsage();
        return 1;
    }
Then we need to halt the target using SourcePoint, and do a LoadCurrent to bring in the source and symbols:
Next steps requires judicious use of the three different types of single-step functionality within SourcePoint:
Step Into: This single-steps the next instruction in the program and enters each function call that is encountered. This is useful for detailed analysis of all execution paths in a program.
Step Over: This single-steps the next instruction in the program and runs through each function call that is encountered without showing the steps in the function. This is useful for analysis of the current routine while skipping the details of called routines.
Step Out Of: Causes the processor to run until it comes to the end of the current subroutine and returns to the next high level of the call stack. This is useful as a quick way to get back to the parent routine.
And, you can selectively place the cursor on a particular line, as another way to do a Step Over. You’ll get a feel for this when you try it.
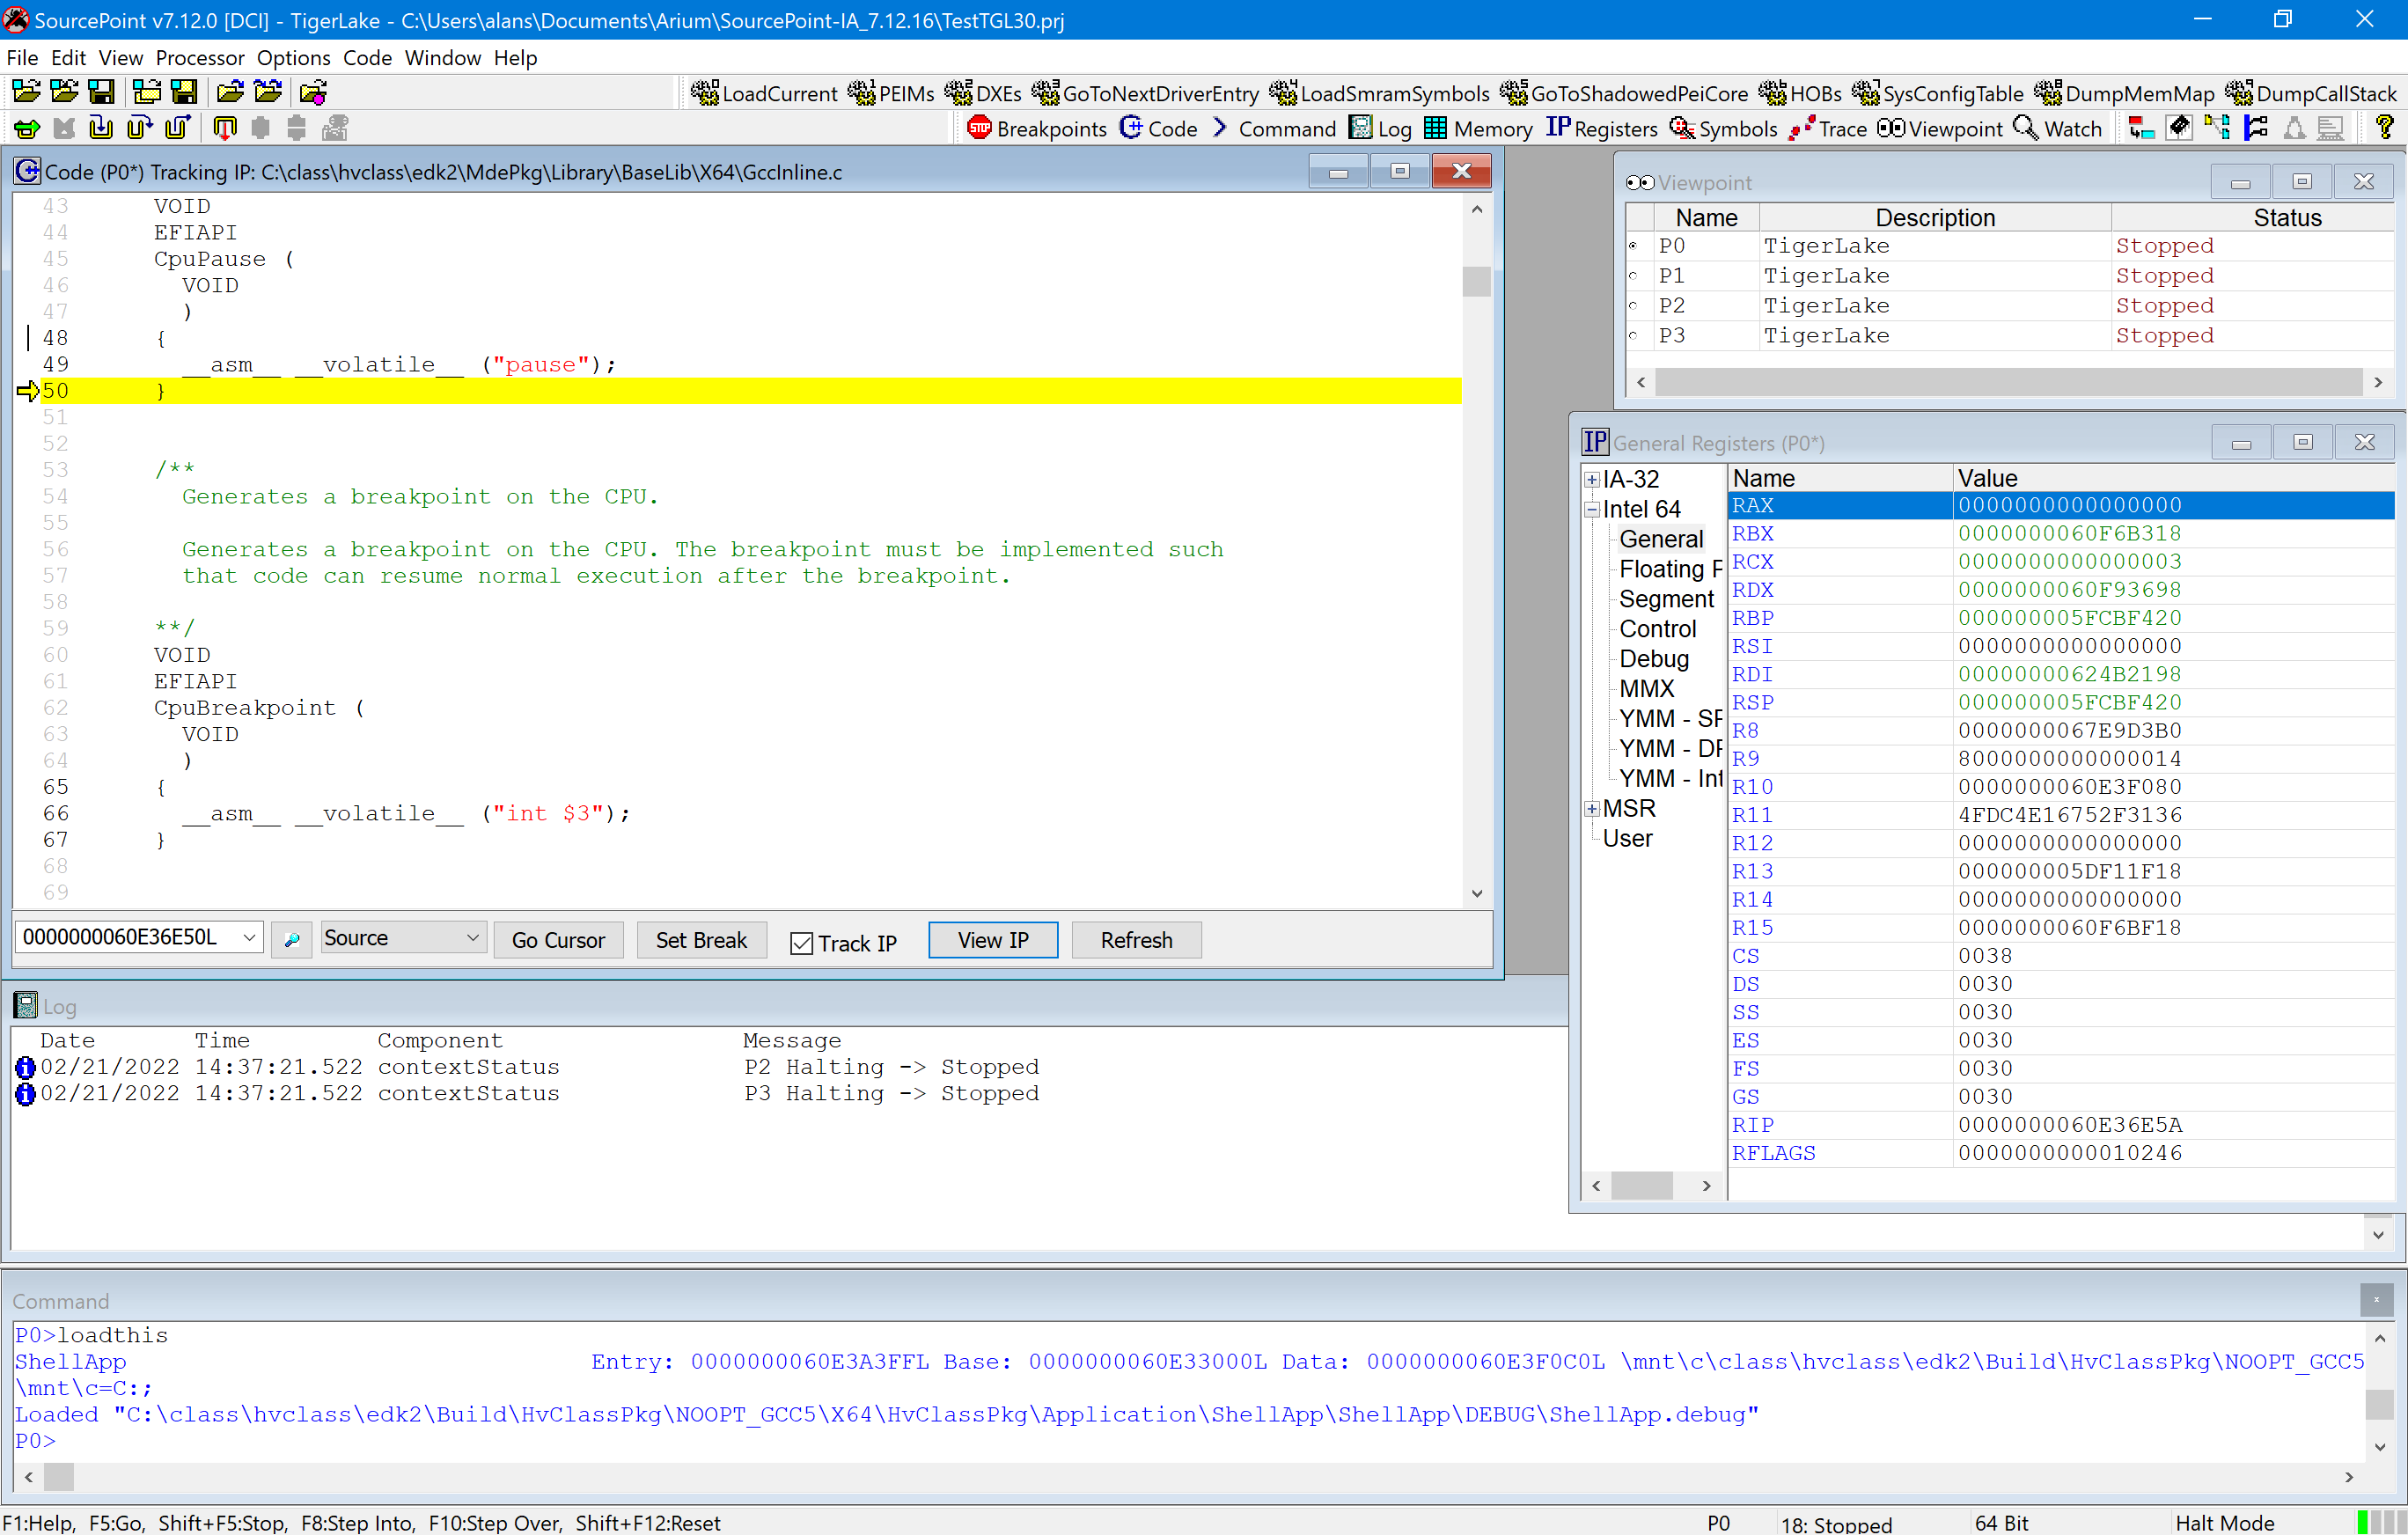
Single-stepping takes you into the deadloop source code residing in MdePkg\Library\Baselib\CpuDeadLoop.c:
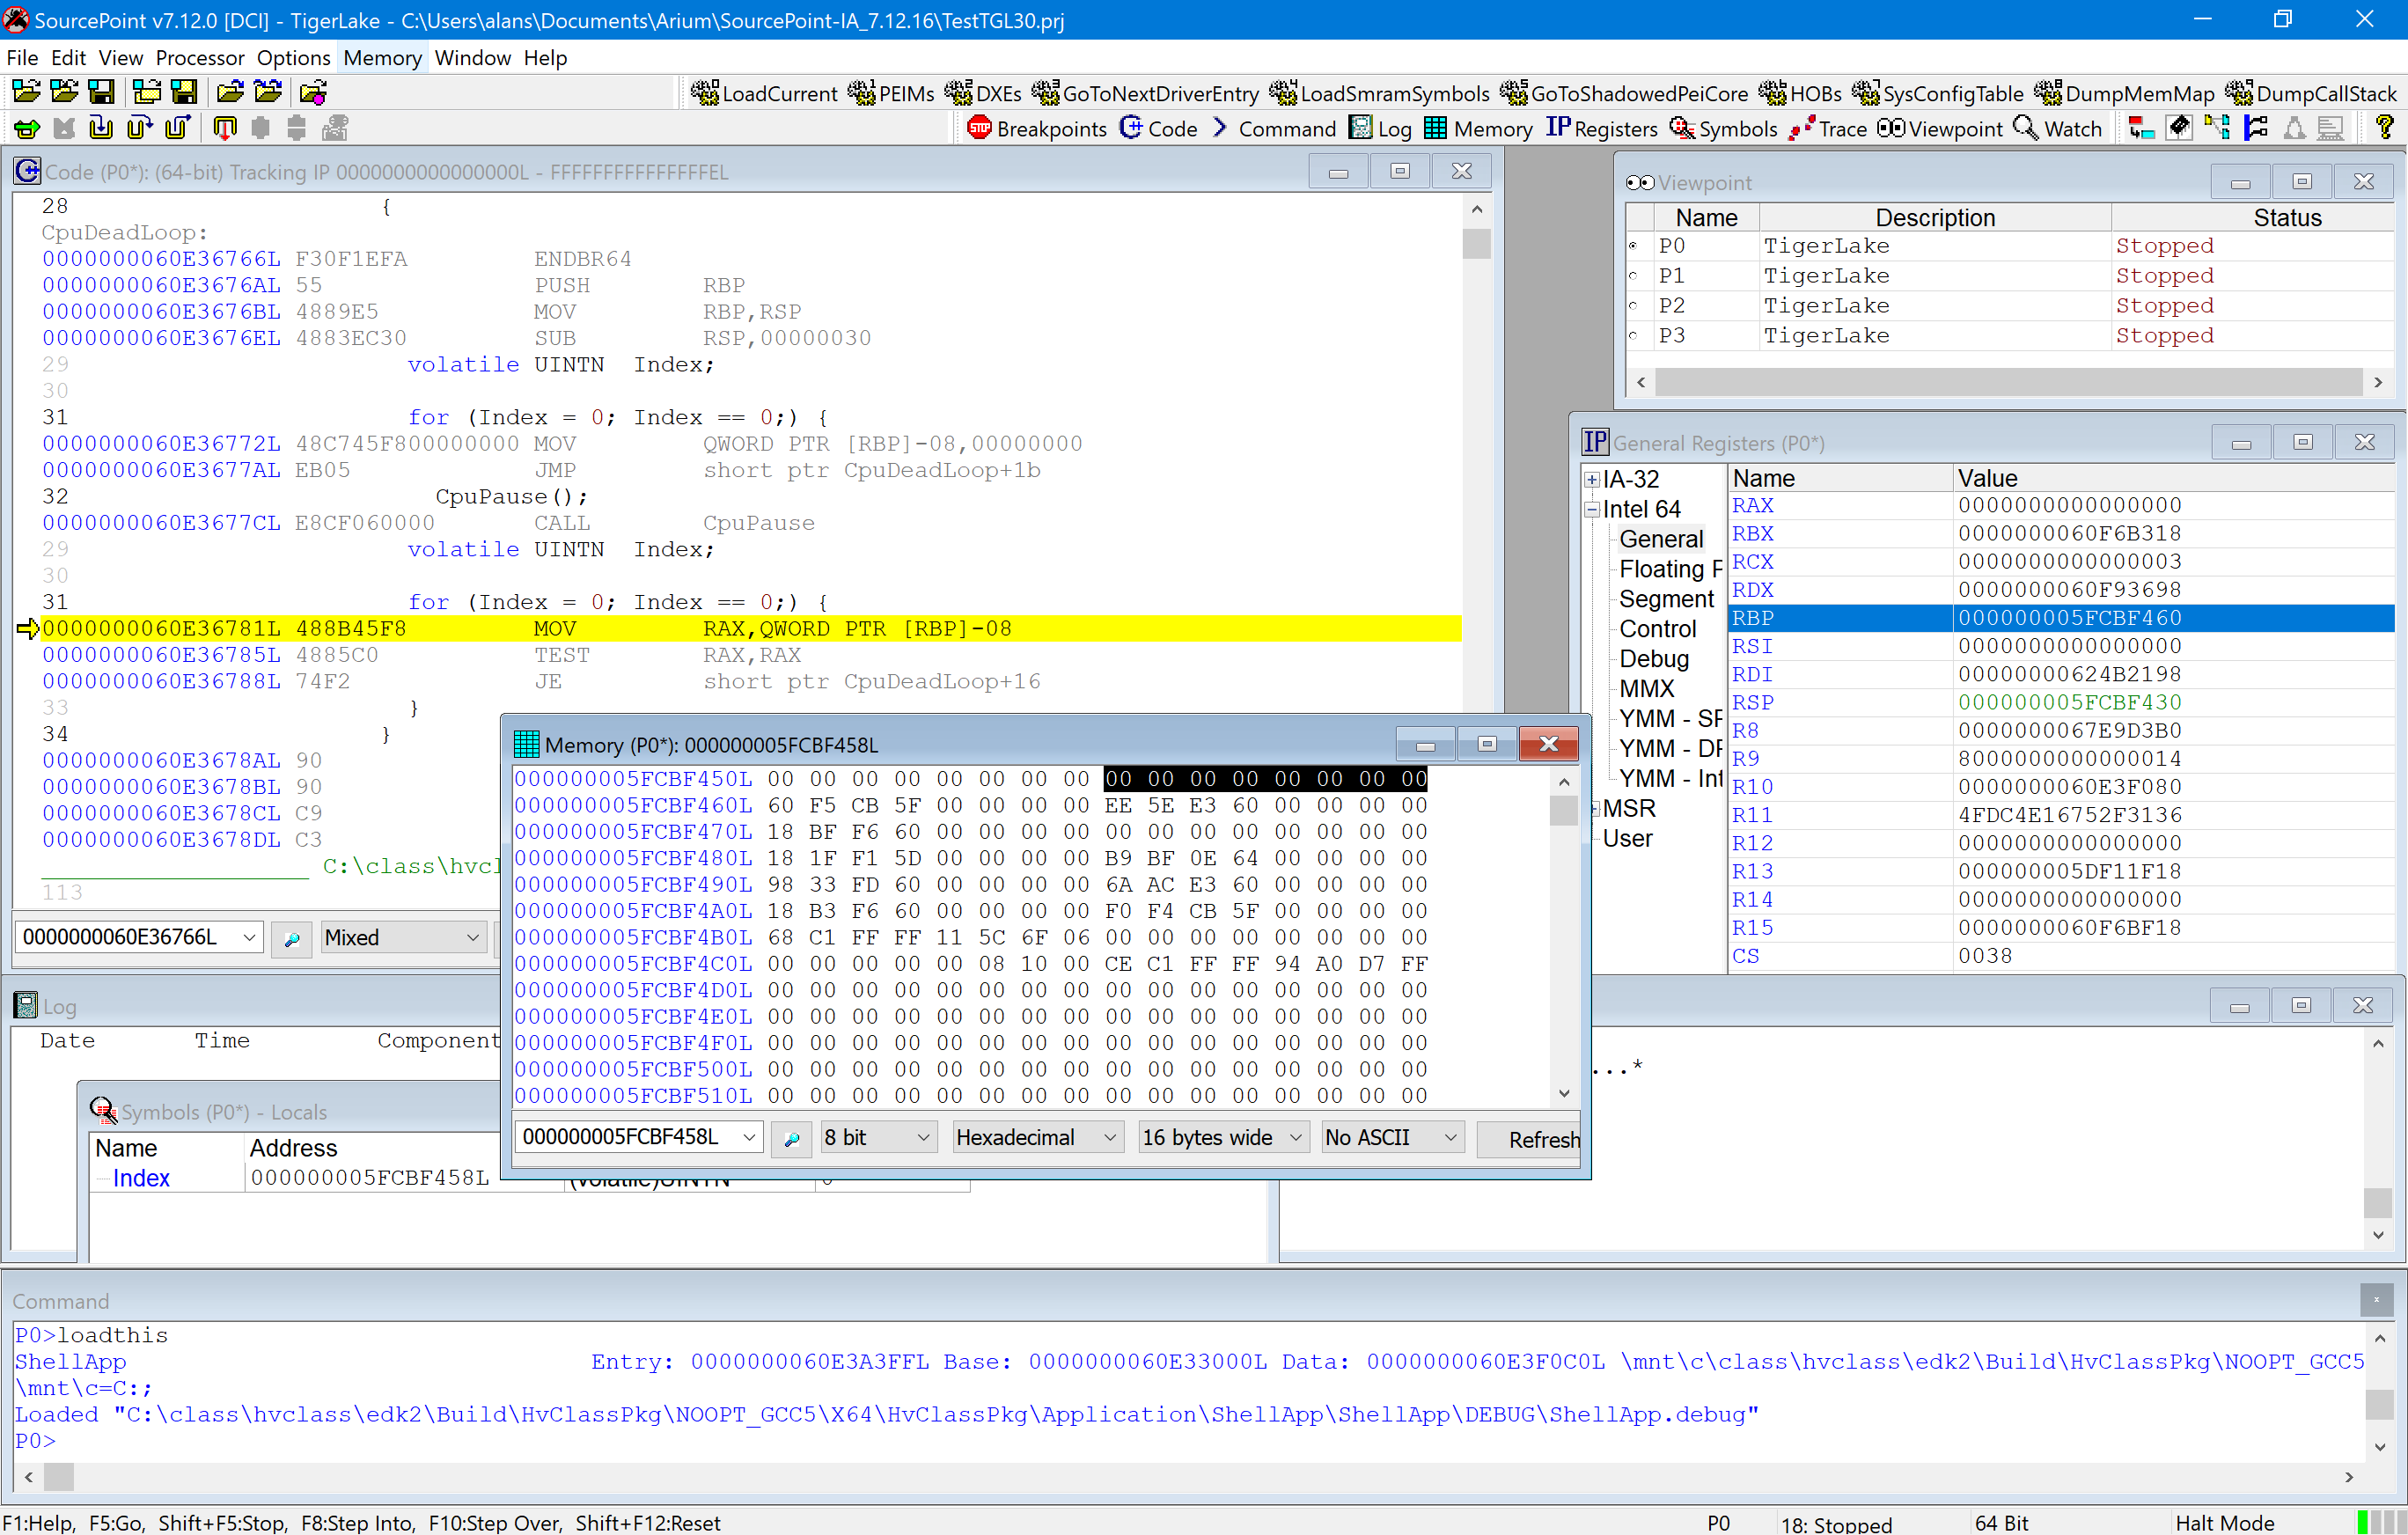
There are quite a few things to see here, so it’s worthwhile staring at for a minute. I opened up the Symbols window so we can see the variables local to this function (that is, Index). You see its value is zero. And I’ve switched the Code window from Source to Mixed, so we can see the assembly language. There’s a MOV, TEST RAX, RAX and a JE as the first instructions that comprise ; that means it will jump if RAX is 0, which it is.
There are several ways to escape a deadloop and start your debugging session. You can change the value of RAX to something non-zero. You can change the contents of the memory pointed to by RBP. You can alter the memory that initializes the value of RAX. You can NOP the deadloop code. You can change the value of Index from 0 to something else in the Symbols window. There’s even a SourcePoint macro that will do the heavy lifting for you, if you want. In any event, it’s easy to move the instruction pointer forward, escape the deadloop, and start debugging.
The first thing that ShellApp does after escaping the deadloop is to make a call to InitializePlatformApi():
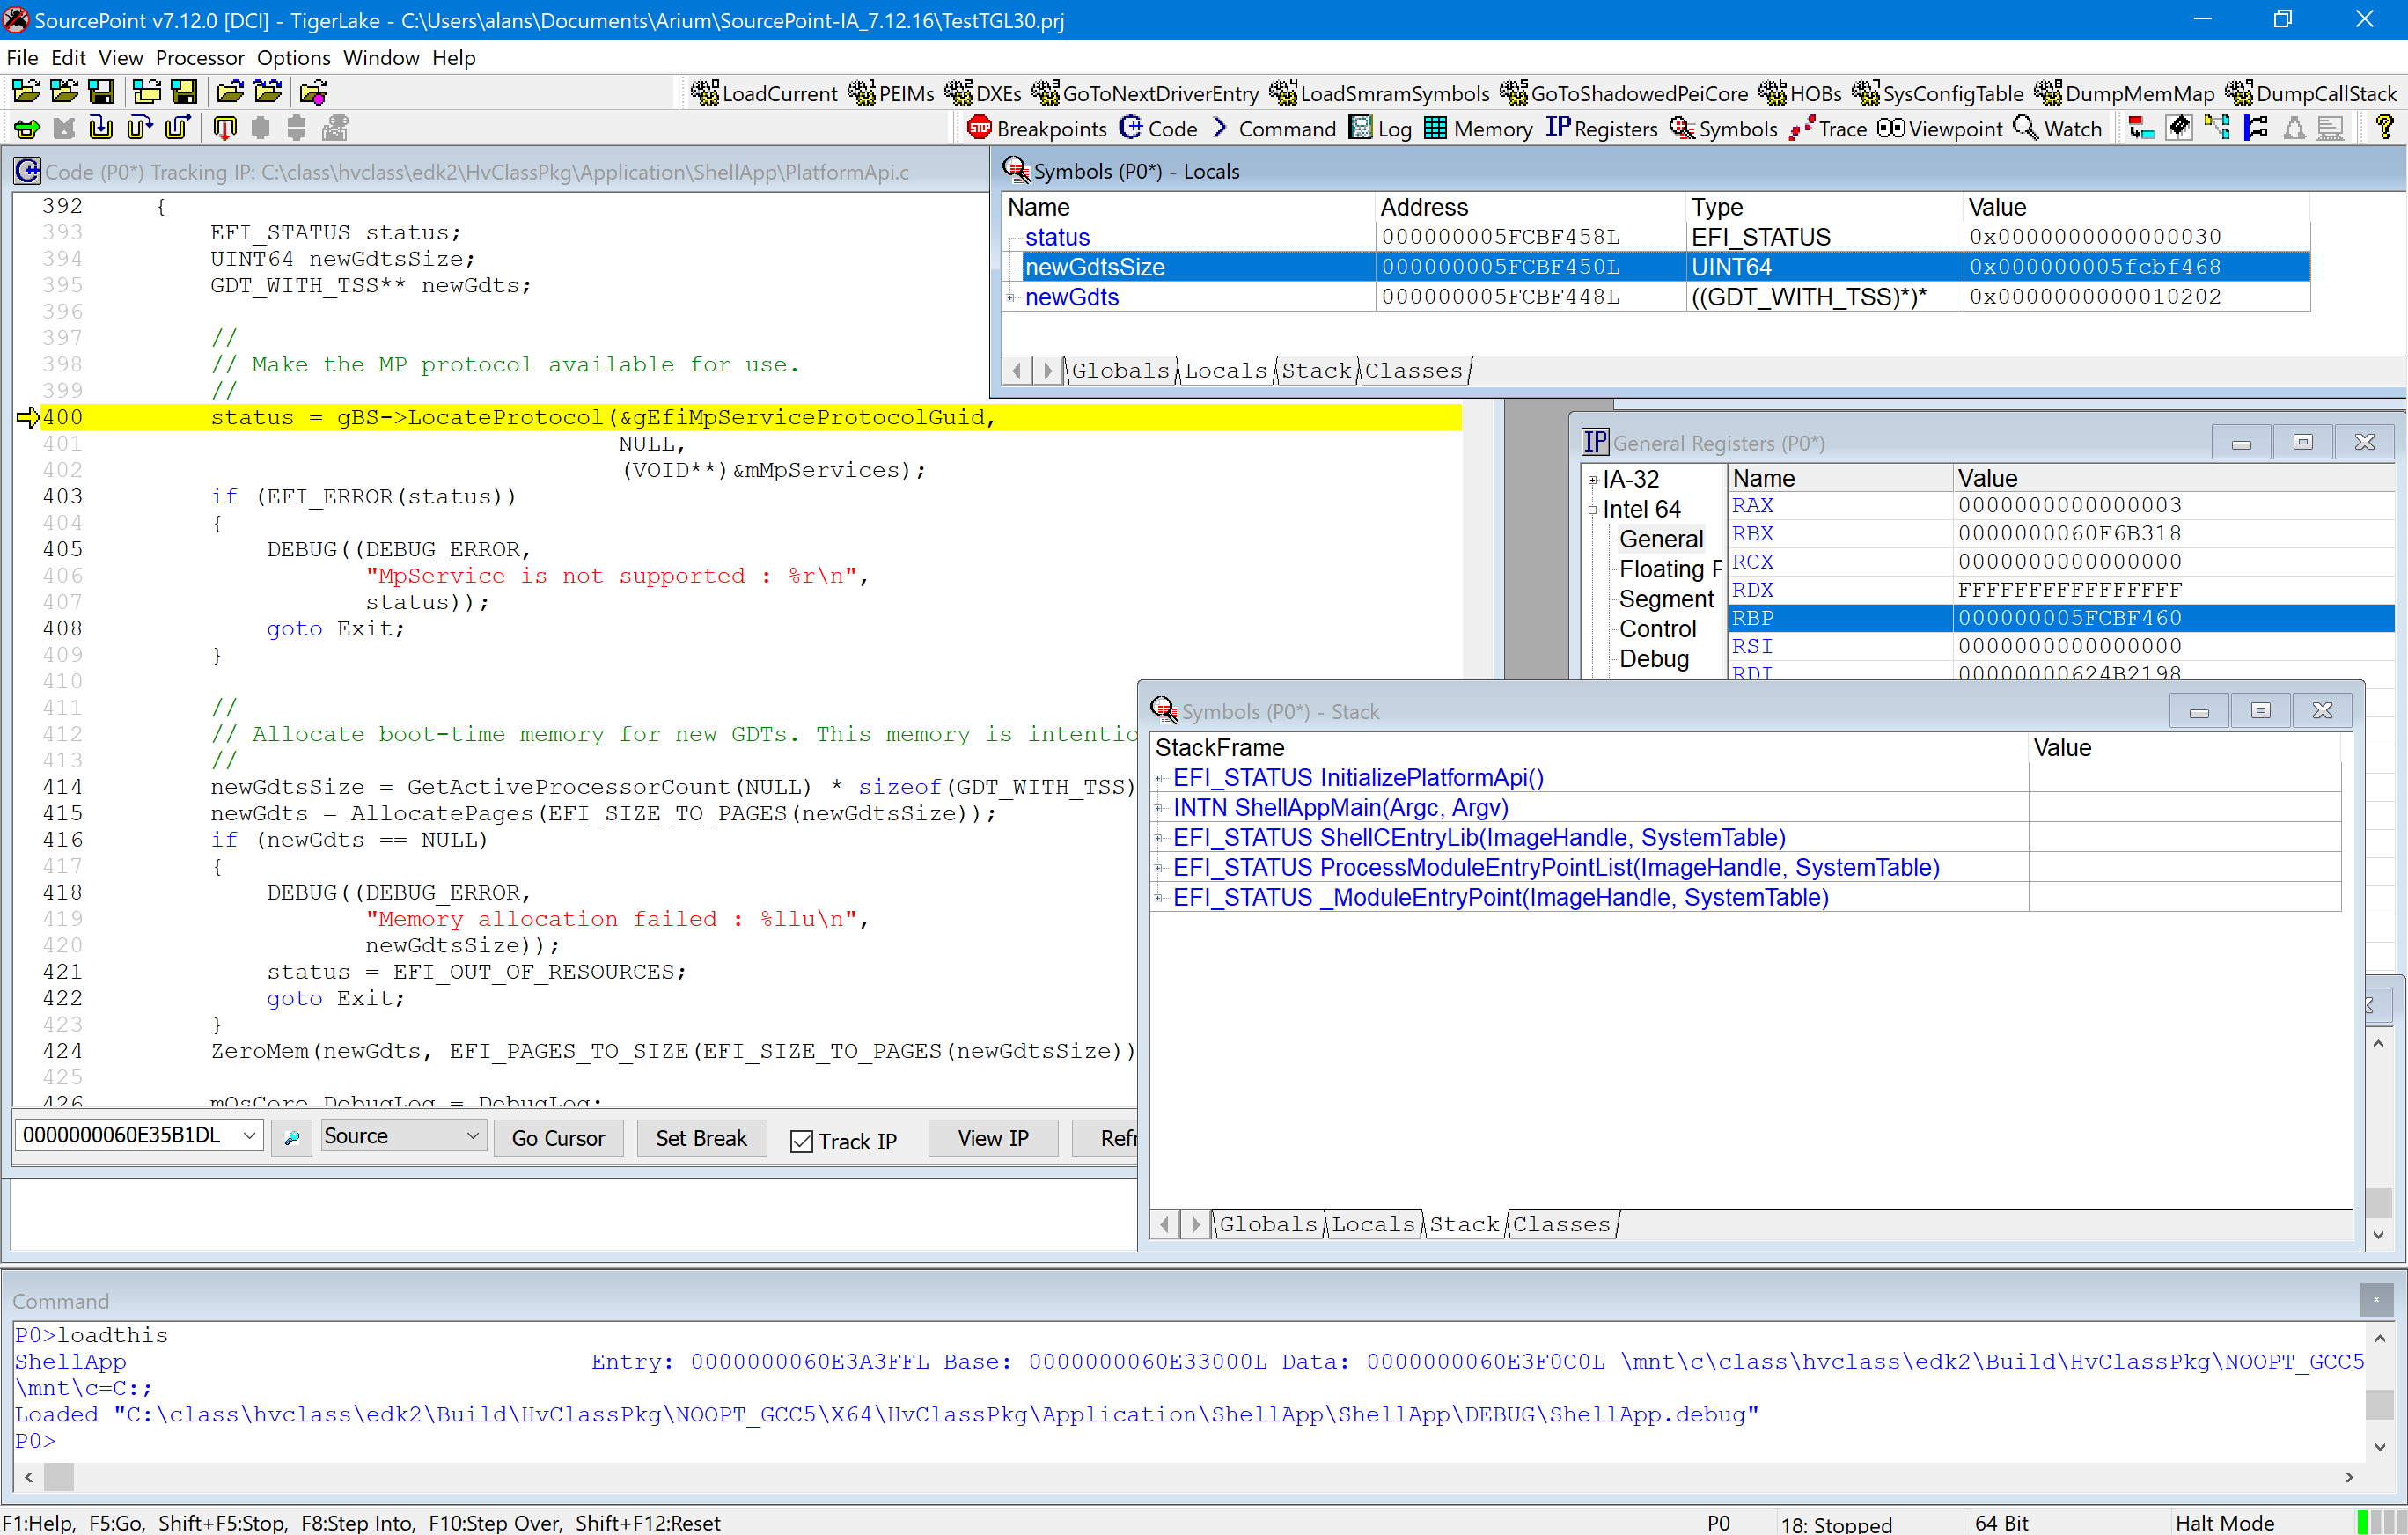
You can open up multiple windows at any time. Above, I’ve opened Symbol windows for both the Locals and the Stack, to watch what’s going on.
This is Satoshi’s own code used to implement the UEFI PLATFORM_API_INTERFACE. I need, at some point, to read up on this.
After the initialization, ShellApp invokes the HandleLoadCommand() routine. Judicious use of Go Cursor, and/or Step Into/Step Over/Step Out Of takes us there.
HandleLoadCommand(), which is part of CommandLoad.c, does what appears to be a standard driver loader: it opens the file, reads the contents into memory (that is not later freed, given the hypervisor needs to remain in memory), locates its entry point and executes it.
Continuing to step takes us back into ShellApp, which now successfully completes and we’re back into the UEFI shell.
OK, that’s it for now. Next time I’ll explore some of the other ShellApp commands, and delve deeper into the VMM code itself.