
Wow! It has been a while. I wrote Episode 2 of my open-source explorations into the AAEON Intel Apollo Lake-based Up Squared board back on June 7th. In that episode, I gave directions on how to build the UEFI debug image for the board, complete with source/symbols for consumption by JTAG debuggers like SourcePoint. In this episode, I show source-level debug with SourcePoint, and take advantage of Intel Processor Trace on the board.
What happened in the meantime? Why six months between Episode 2 and this episode? Well, all I can say is that time flies. We’re of course still in the middle of the pandemic – vaccines have still been approved, and with luck I’m hoping to get my shots in March or April of 2021 – and a lot of work-related items came up. I did a webinar with the UEFI Forum entitled JTAG-based UEFI Debug and Trace, and that took a lot of preparation. I taught myself WordPress and helped re-design our new website. We’ve productized and delivered our API for our ScanWorks Embedded Diagnostics product, and customer engagements kept me busy. And I learned to be an organizer for GoToWebinar, taught myself Camtasia, learned Zapier, mastered the Elementor webpage builder, and started dabbling with DirectX 12.
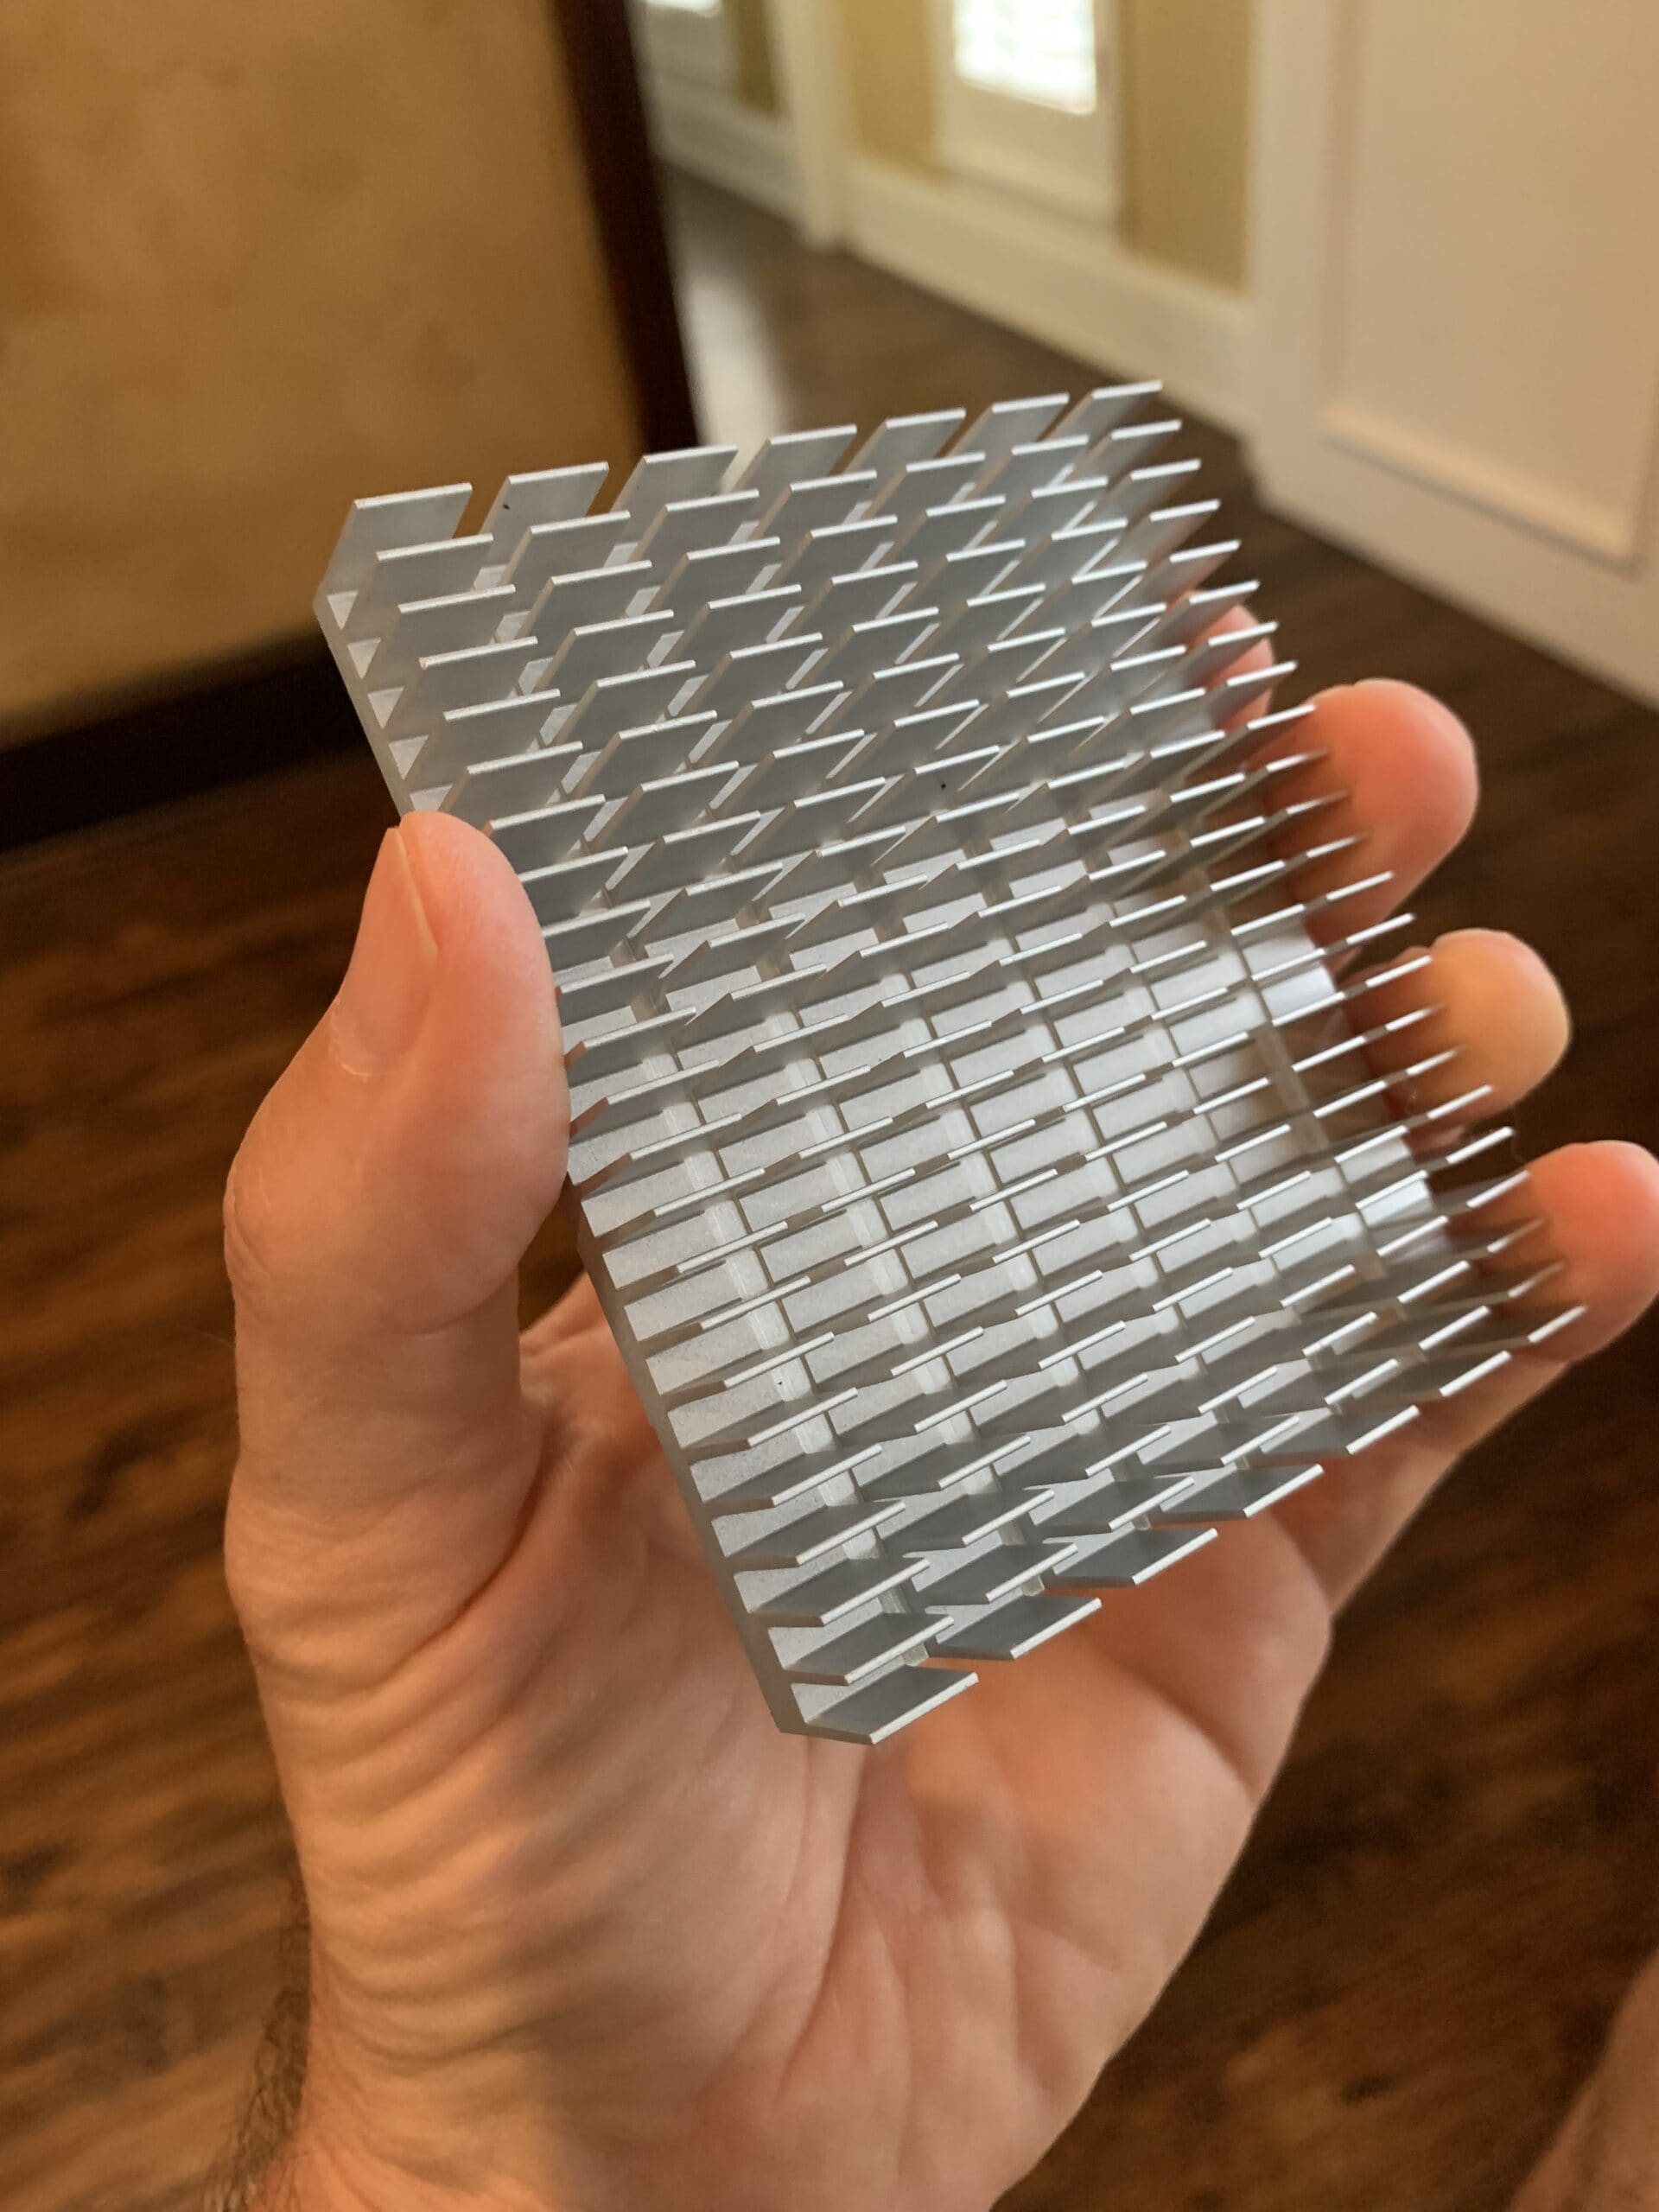
But, enough about me. What about the Apollo Lake-based UP Squared board? Recall from Episode 1 that I used the DediProg to flash the UP Squared with the debug image, after first removing the heat sink:
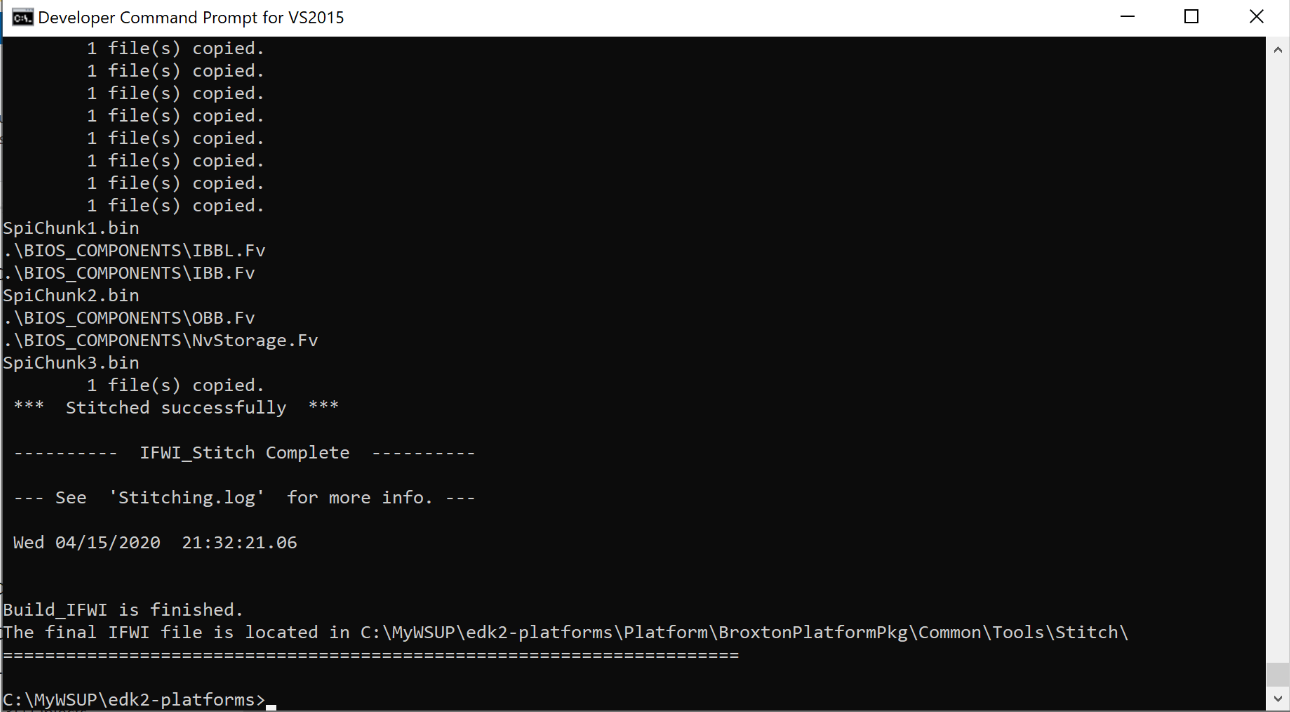
and in Episode 2 I described how to build the image, for those who want to follow in my footsteps:
The next logical step is to show some of the power of source-level debug on this platform.
But first, remember that this board does not have its XDP header exposed, like the MinnowBoard did. The only way to initiate JTAG-based debug is over the Intel Direct Connect Interface (DCI): a USB3 interface into the target. In this case, you go in just over the cable (Note again: it is not a regular USB cable; it’s a special cable, the Intel SVT DCI DbC2/3 A-to-A Debug Cable 1 Meter, part # ITPDCIAMAM1M, from Intel DesignInTools, Mouser, or others. You can possibly damage your target if you use a regular USB cable.
Once DCI is possibly set up, you can do debug just like you have a direct connection through the open-chassis XDP connector. In this instance, I halted the target partway through the booting process, and then used the built-in SourcePoint macro command language to break at the next write to port 80, followed by a “loadthis” to show where in the source we are:

The SourcePoint command string:
go til 80io; wait; ax
is very handy; it runs the target until the next Port 80 write is issued, then displays the contents of the AX register, which contains the output of the OUT command.
Another trick is that if you want to, say, run to a given port number output, as in the AX register being post code “A1”, you can do it this way:
while(ax != 0xa1) {go til 80io; wait; ax}
Pretty cool, huh?
You can see from the diagram above, if you look carefully, that we stopped at post code x’20FF’, and we are in the SmmControl module.
Looking at the source code in the Code window, we see the yellow bar where exactly we halted:
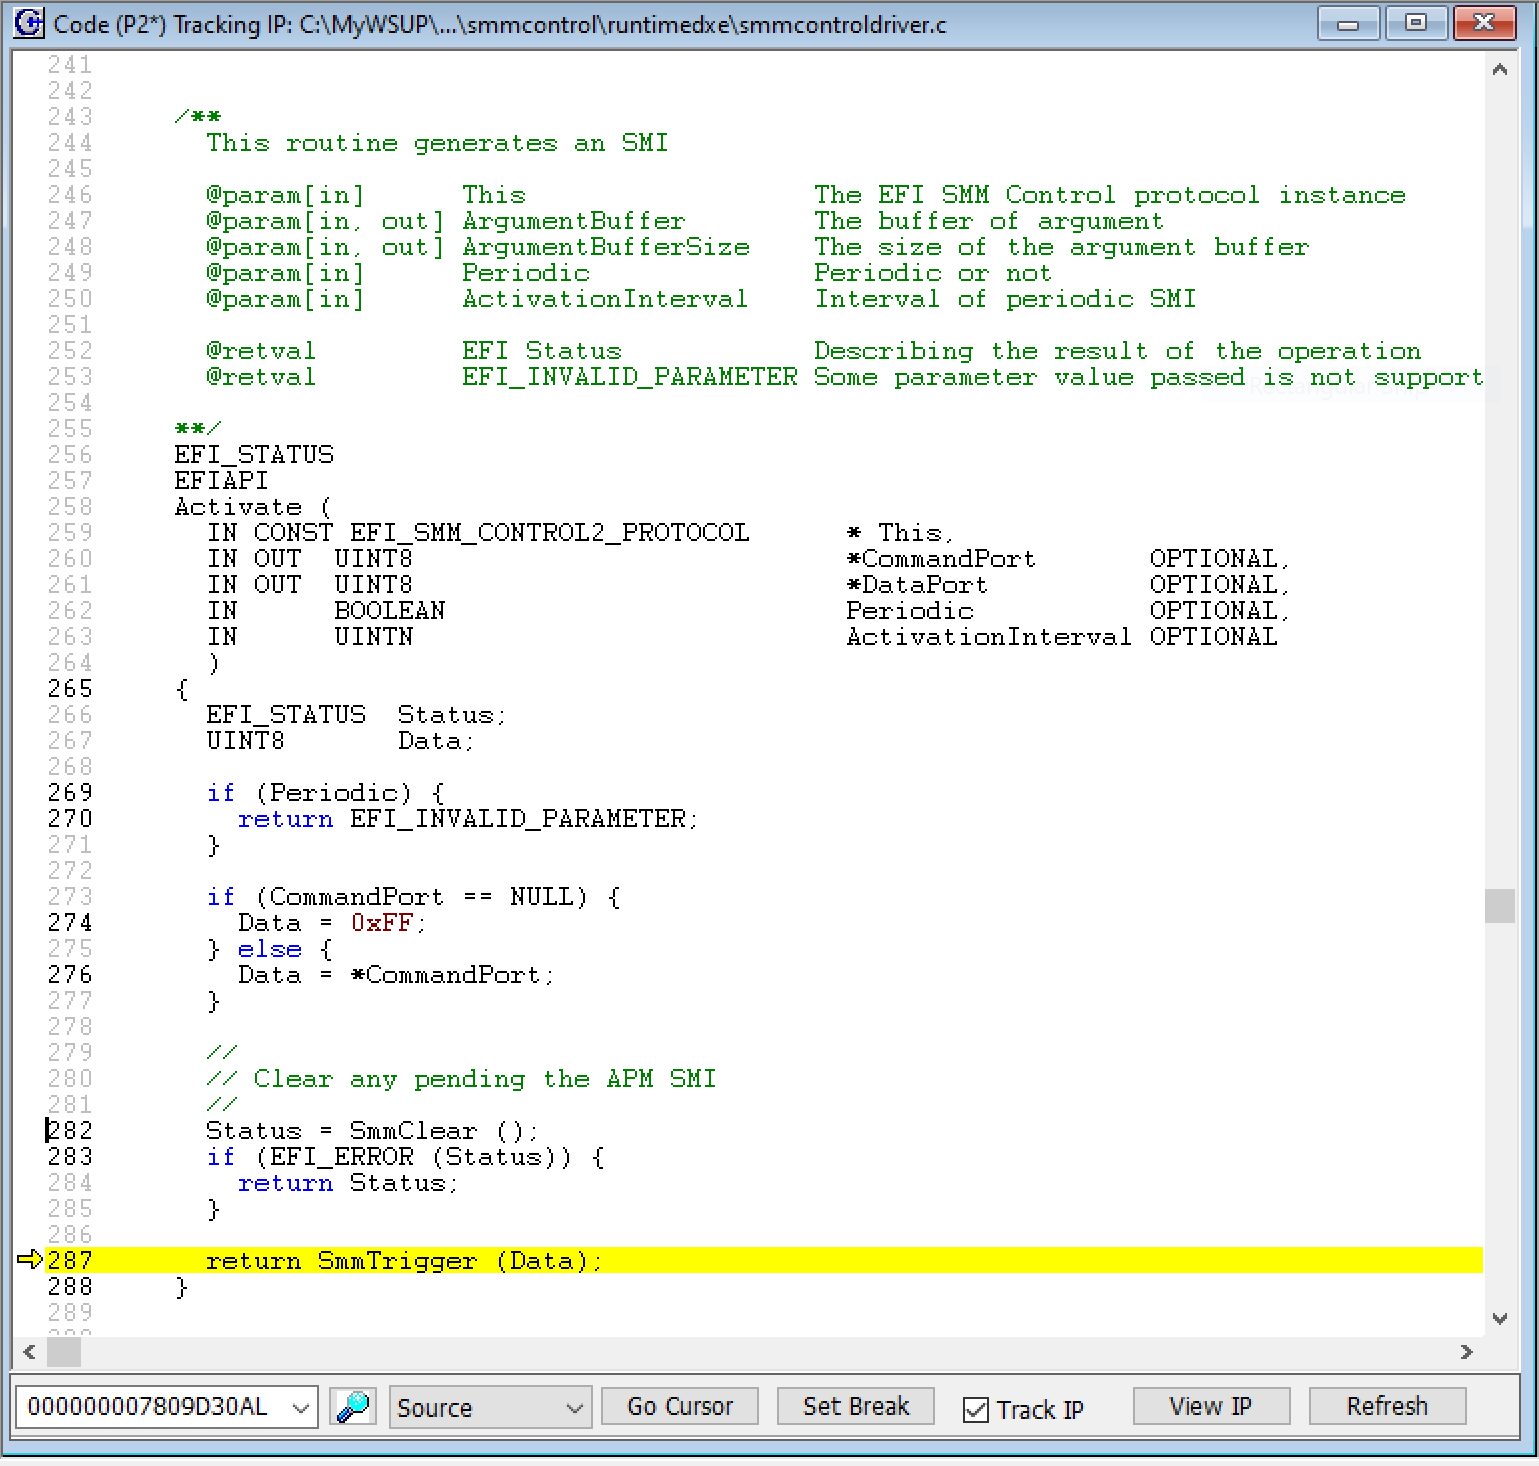
We’re in the Activate function, which is in smmcontroldriver.c, right at the return statement that returns the value of SmmTrigger(Data).
If we go into Mixed mode, we can see the assembly language instructions intermixed with the ‘C’ source:
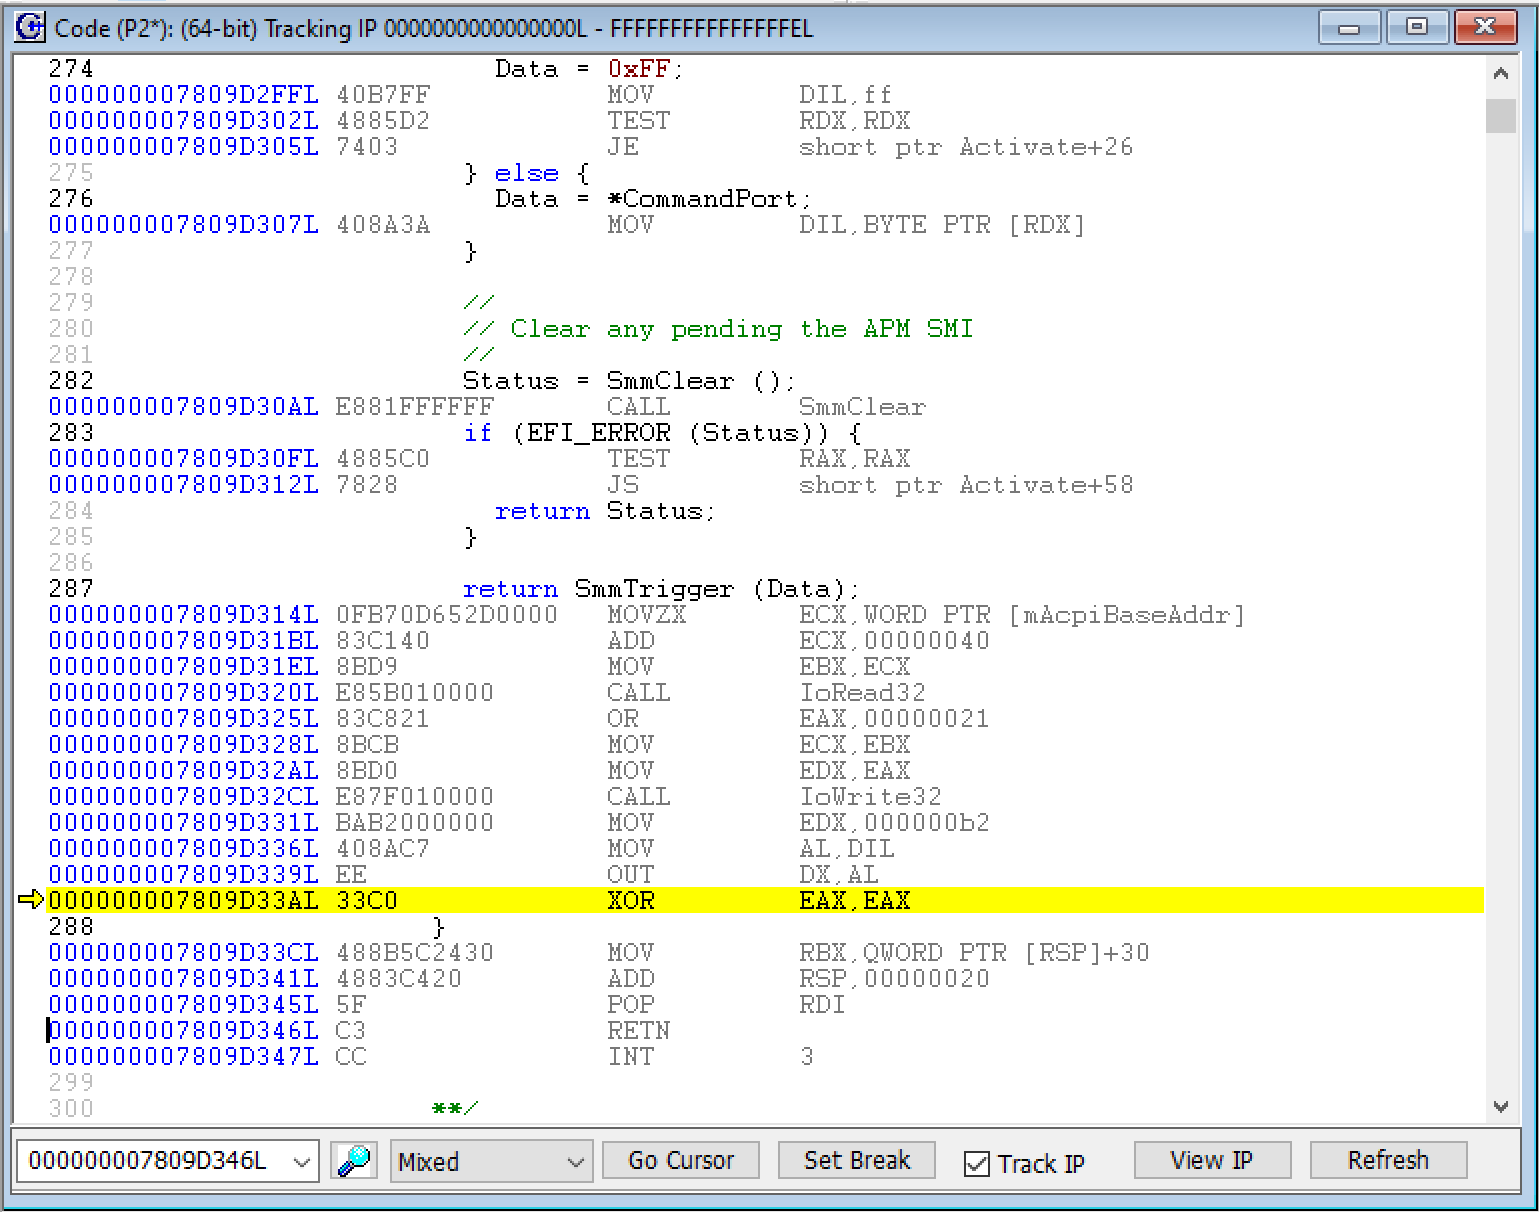
Which makes sense! The instruction pointer is actually right after the OUT instruction.
There’s a lot of areas to explore here. Firstly, I had PuTTY running in the background collecting the output from the serial port, and here is what was frozen on the screen when I halted:
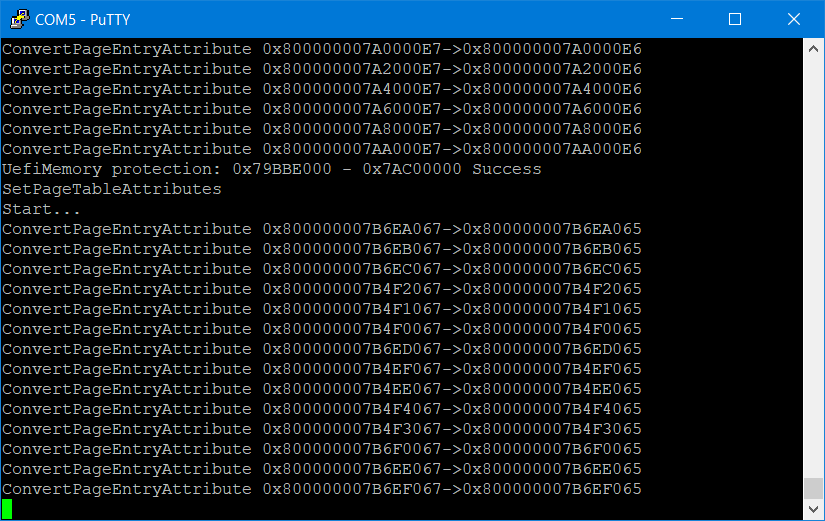
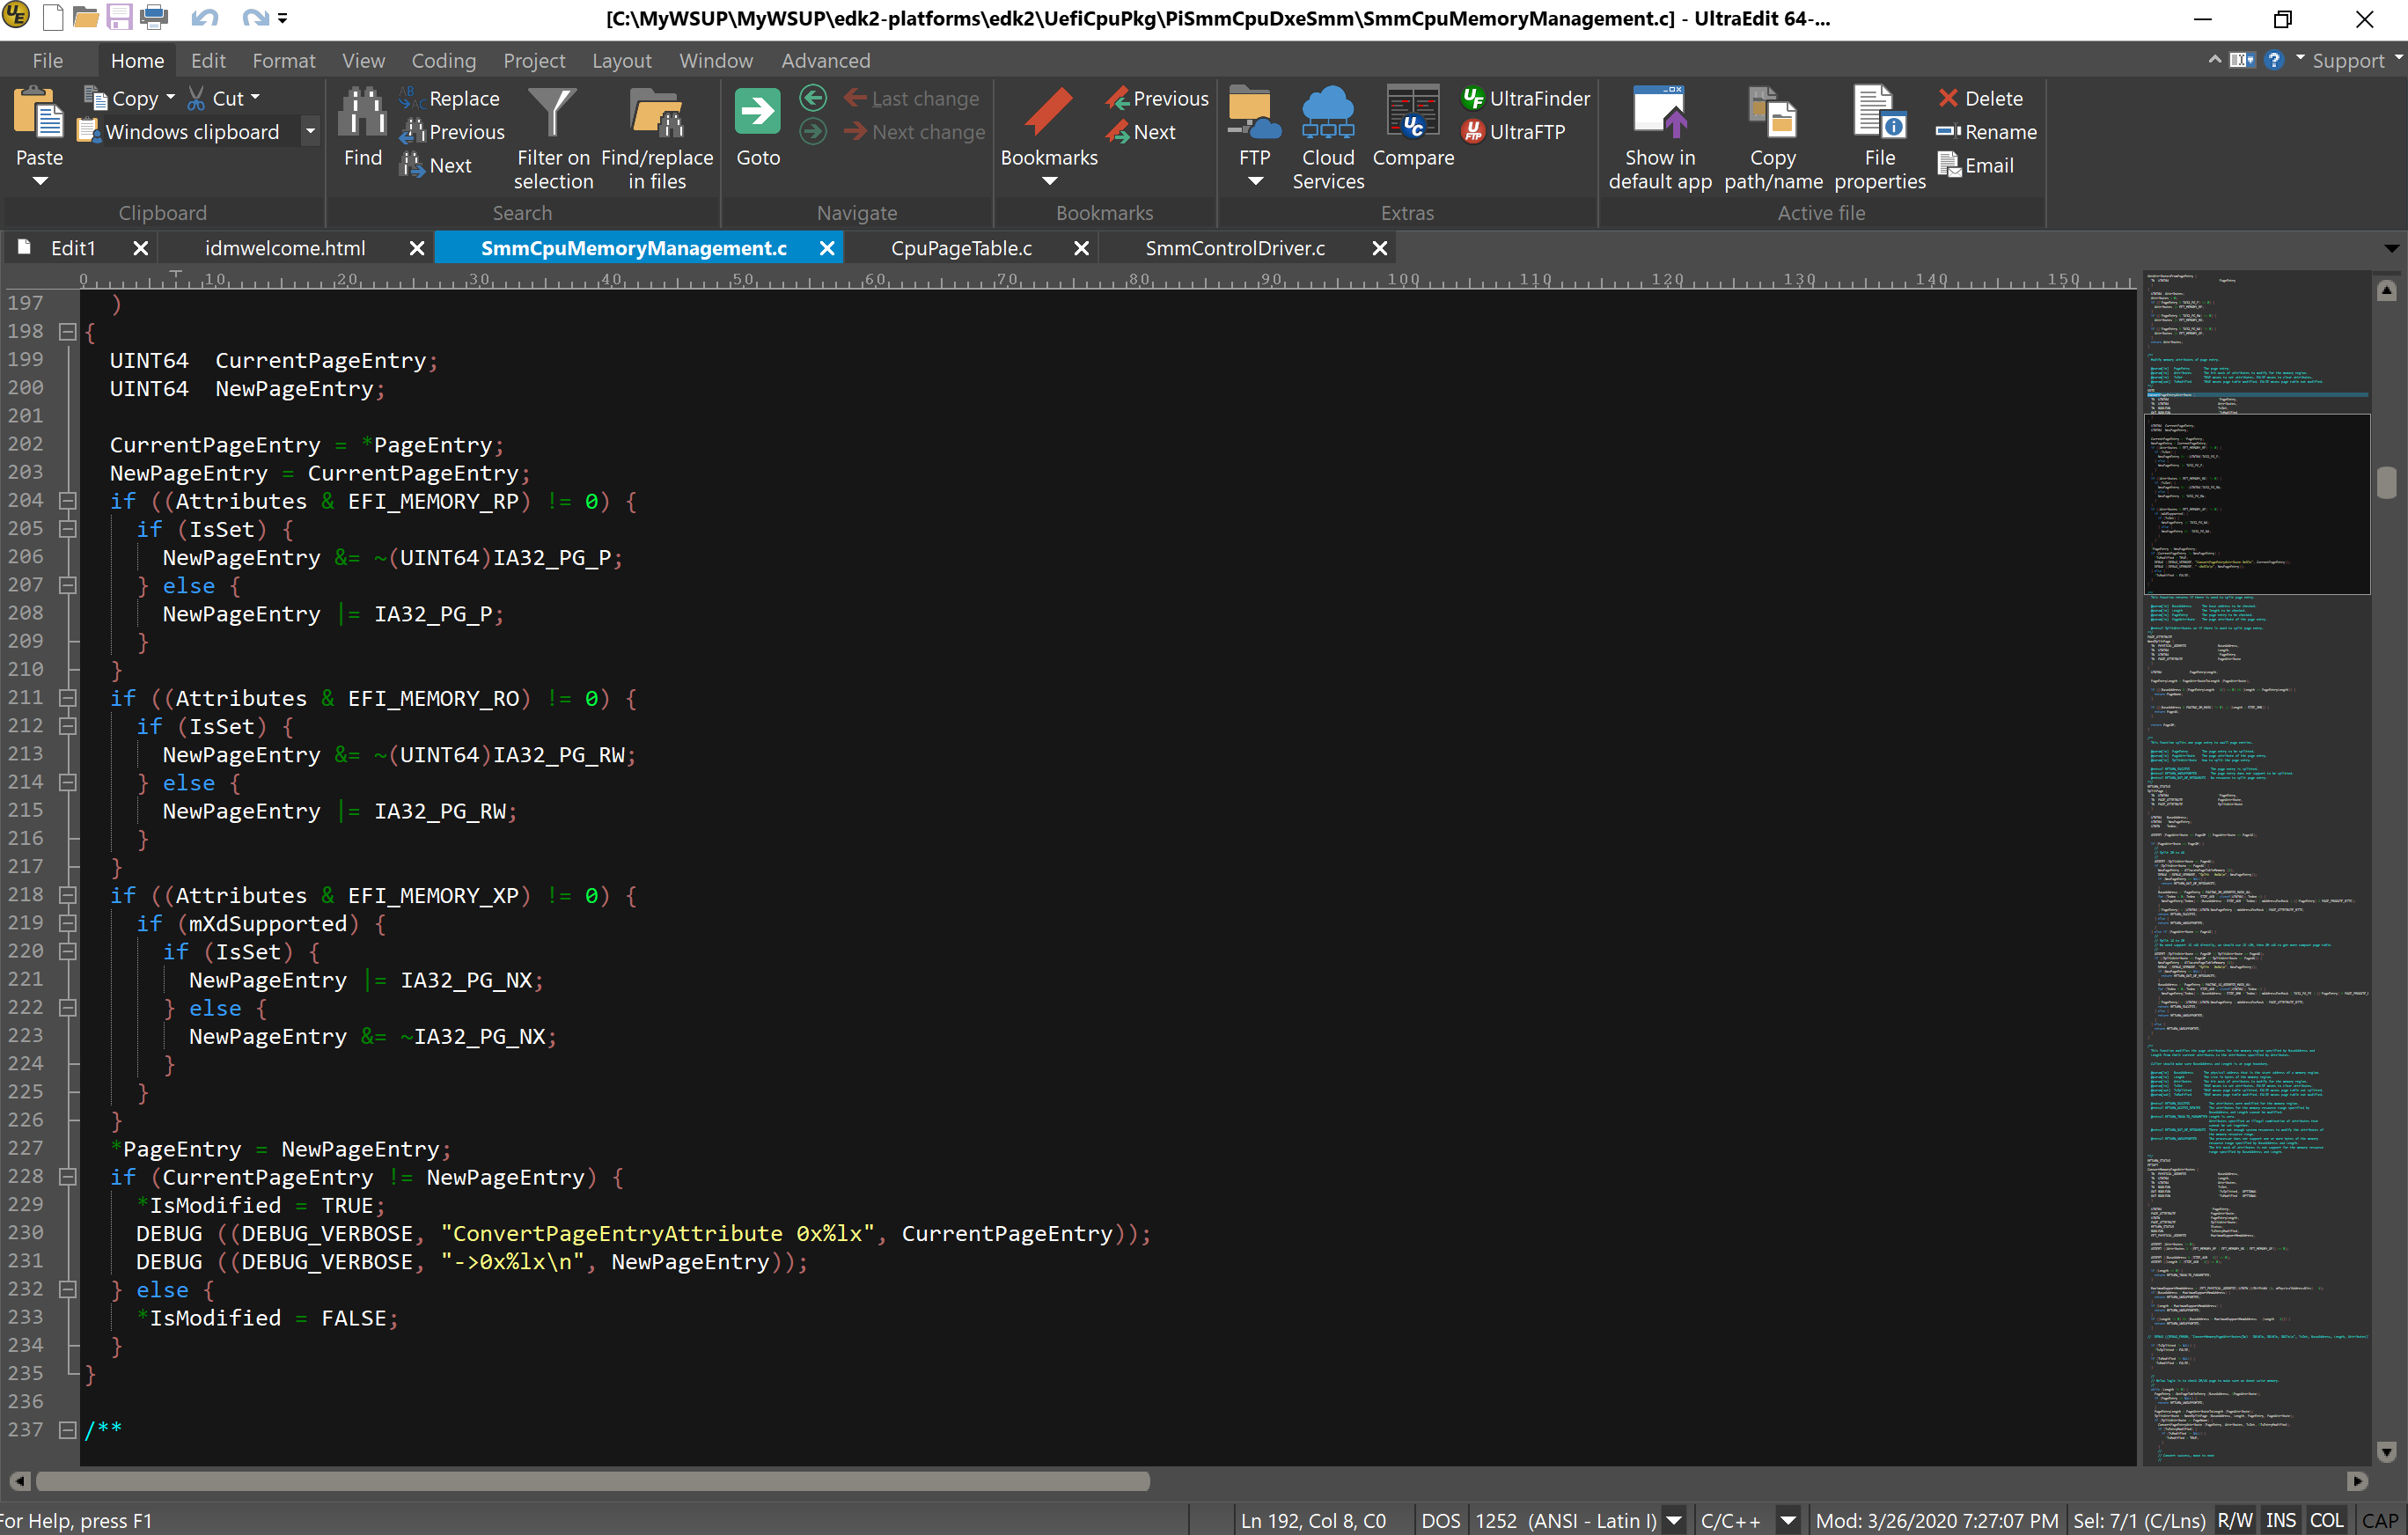
Doing a search within the build files on the string “ConvertPageEntryAttribute” yields the below, line 230-231, with SmmCpuMemoryManagement.c being the source:
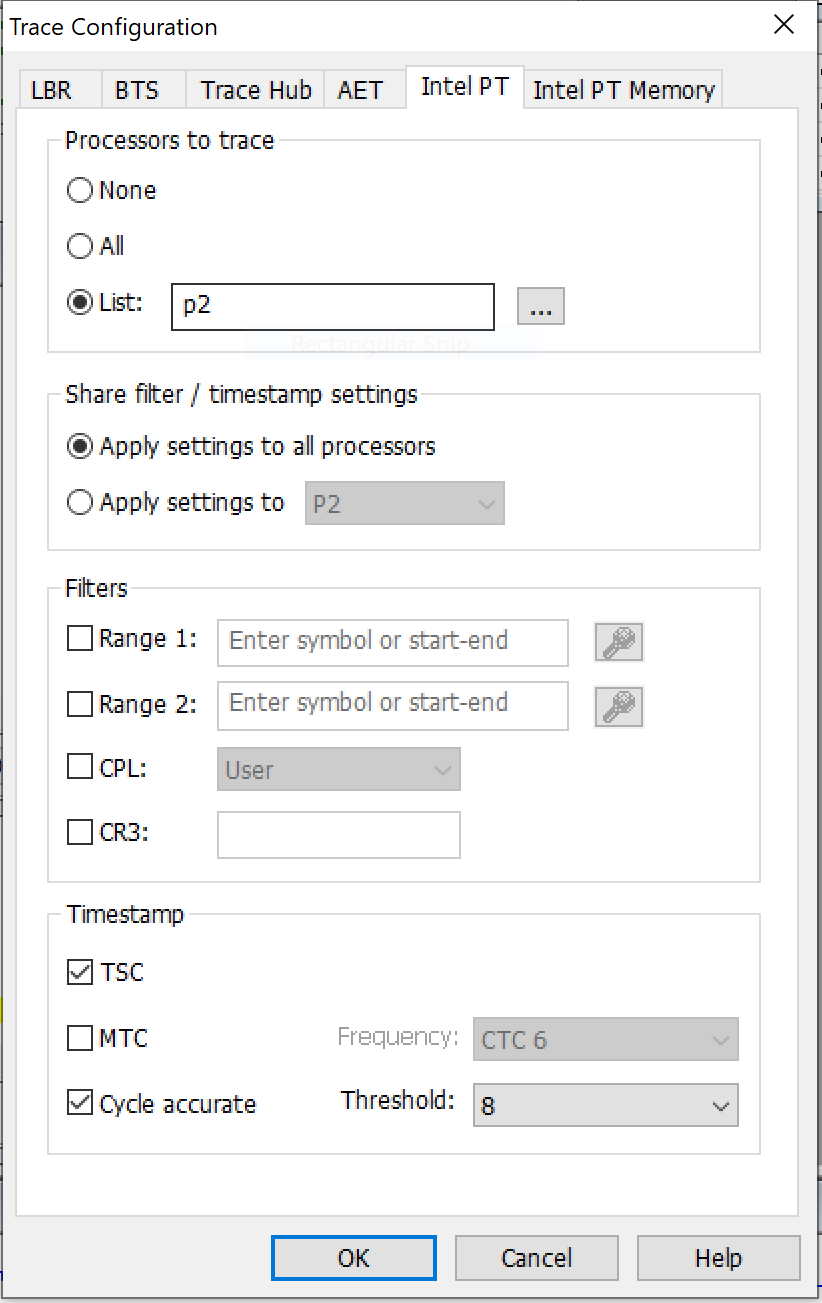
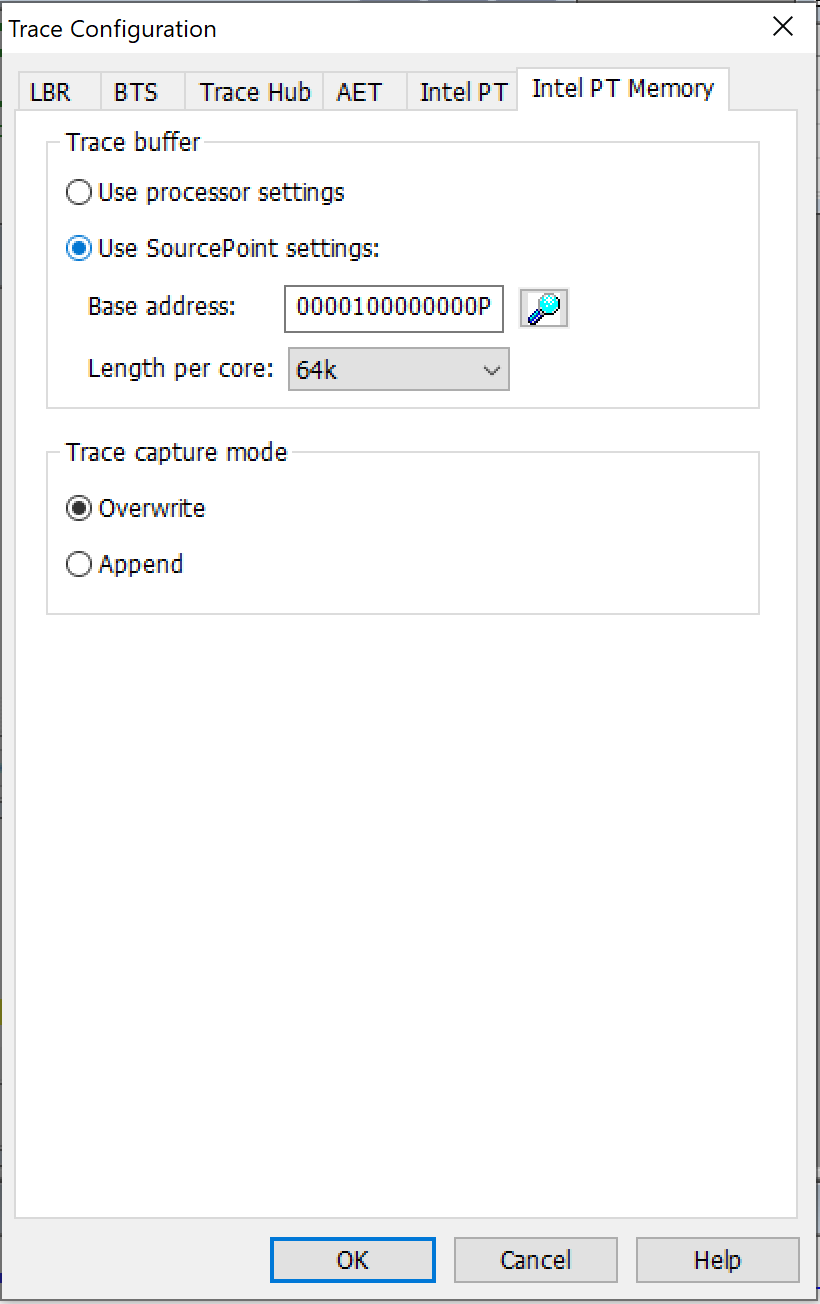
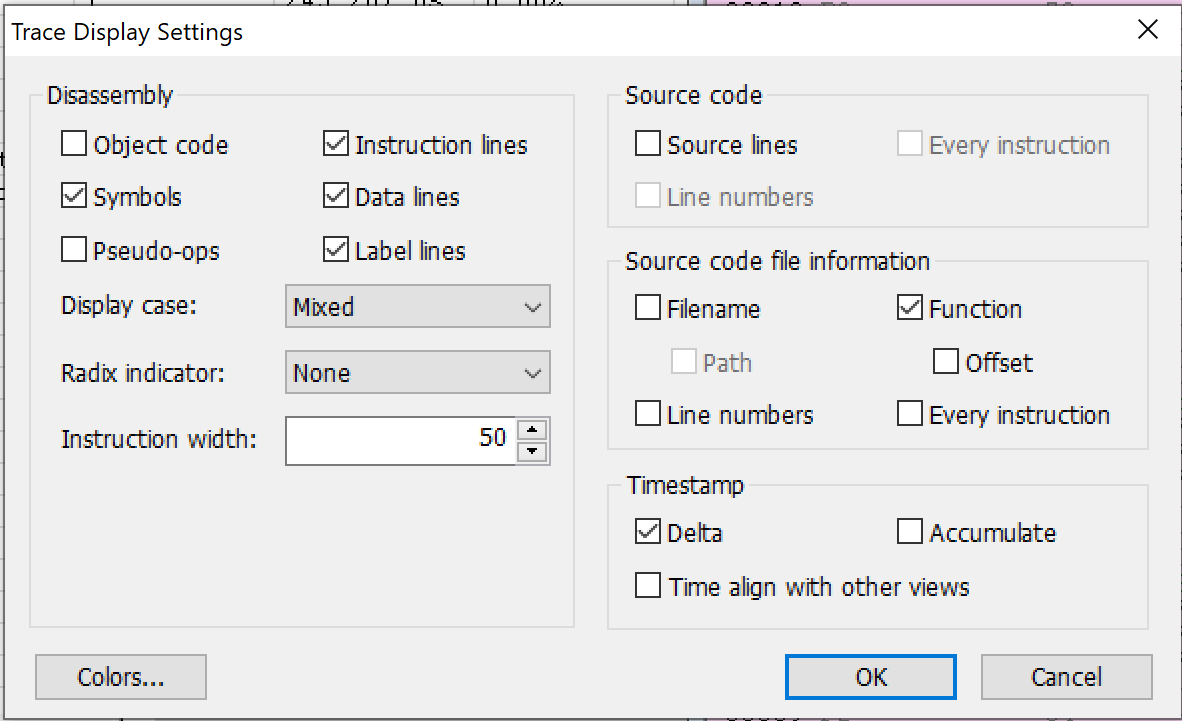
Interesting, but let’s look at the code itself in more detail. It sure would be good if we could see the code flow in its entirety. Luckily, I started up Intel Processor Trace before issuing the SourcePoint macro command that halted the target at post code x’20FF’, by clicking on the Trace button and setting the following parameters:
Let’s do another Go/Halt and get some fresh data with Intel Processor Trace fully enabled. Here is the screen output:
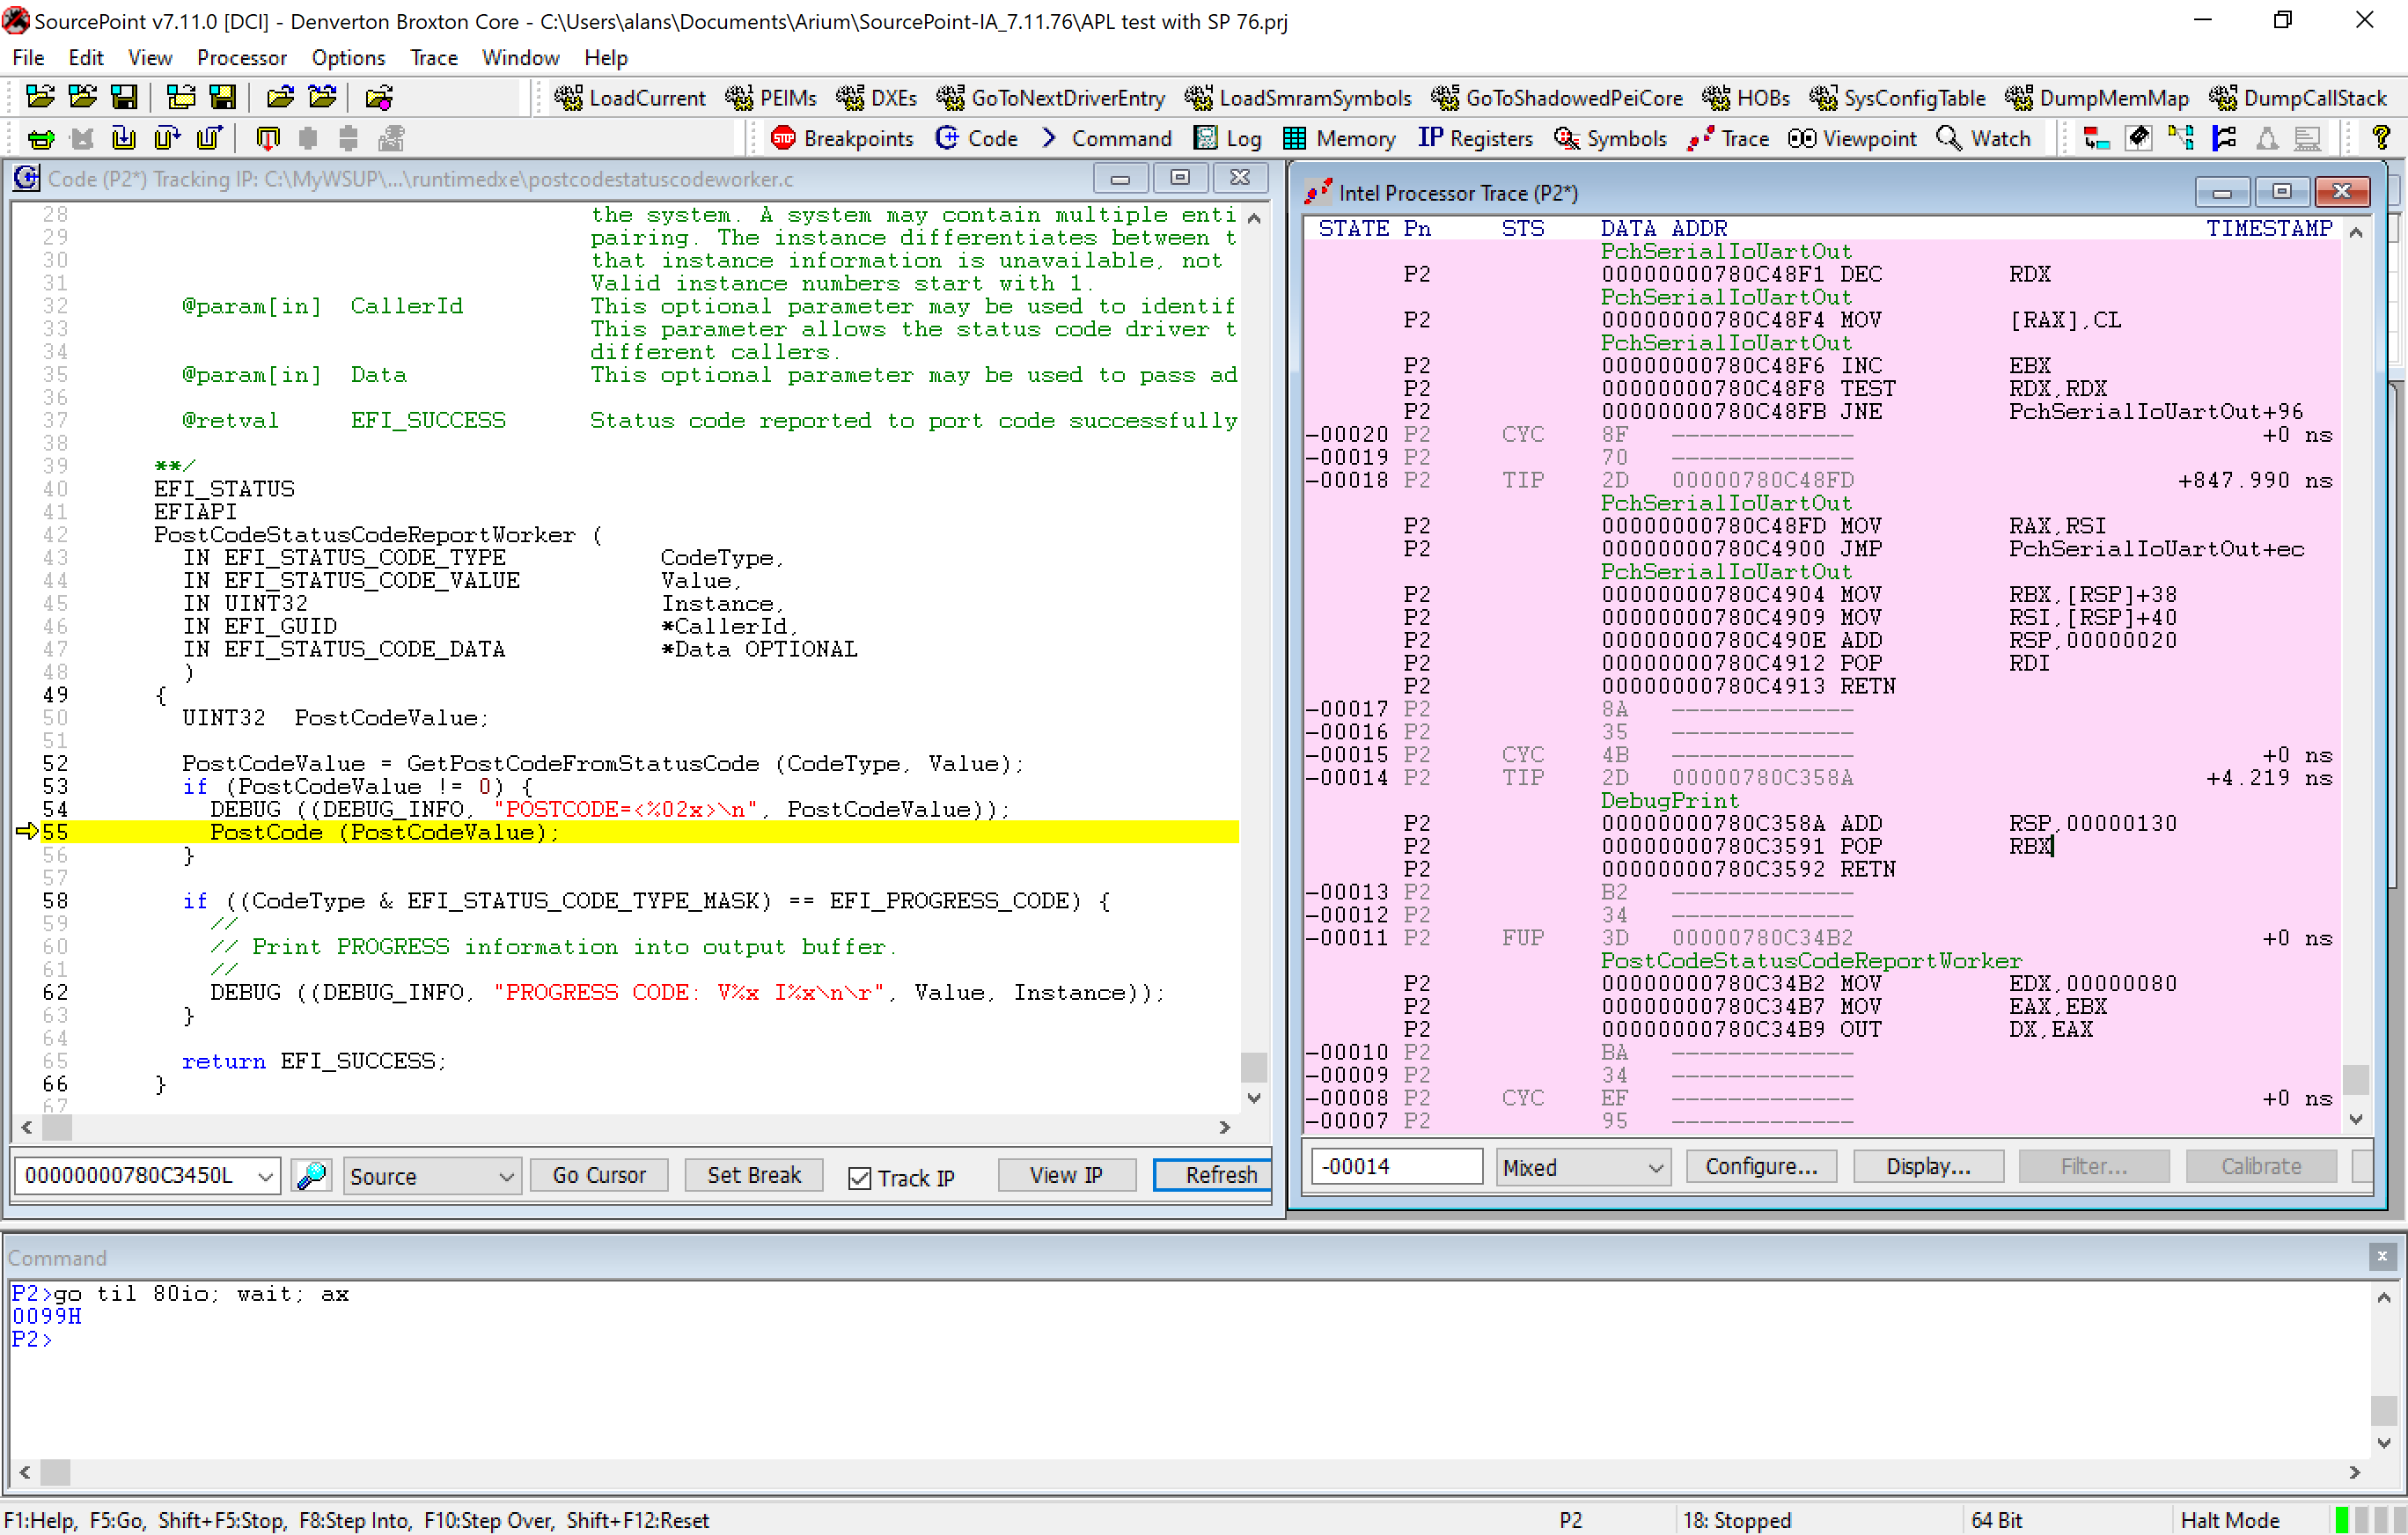
The instruction pointer in yellow is at PostCode(PostCodeValue) from the Code window. And you can see the OUT DX, EAX in the Intel Processor Trace window.
And the PuTTY serial port output looks like this:
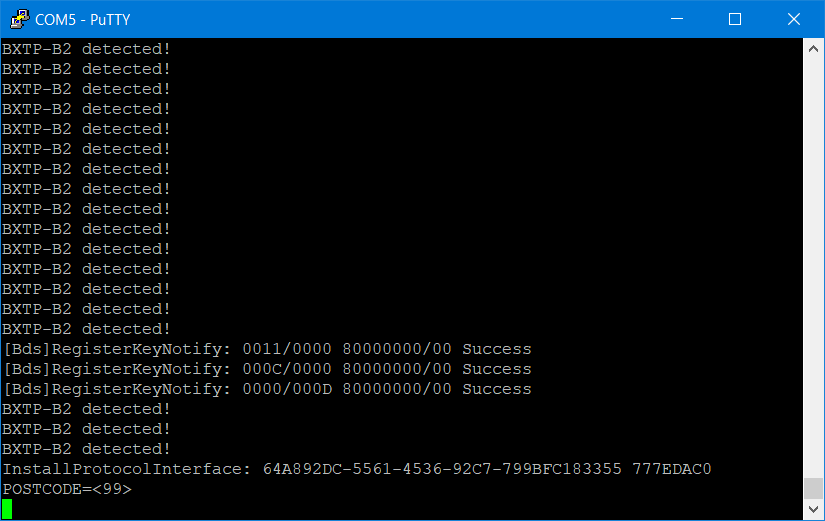
Note that the POSTCODE=<99> above matches that in the SourcePoint Command window, the value of AX.
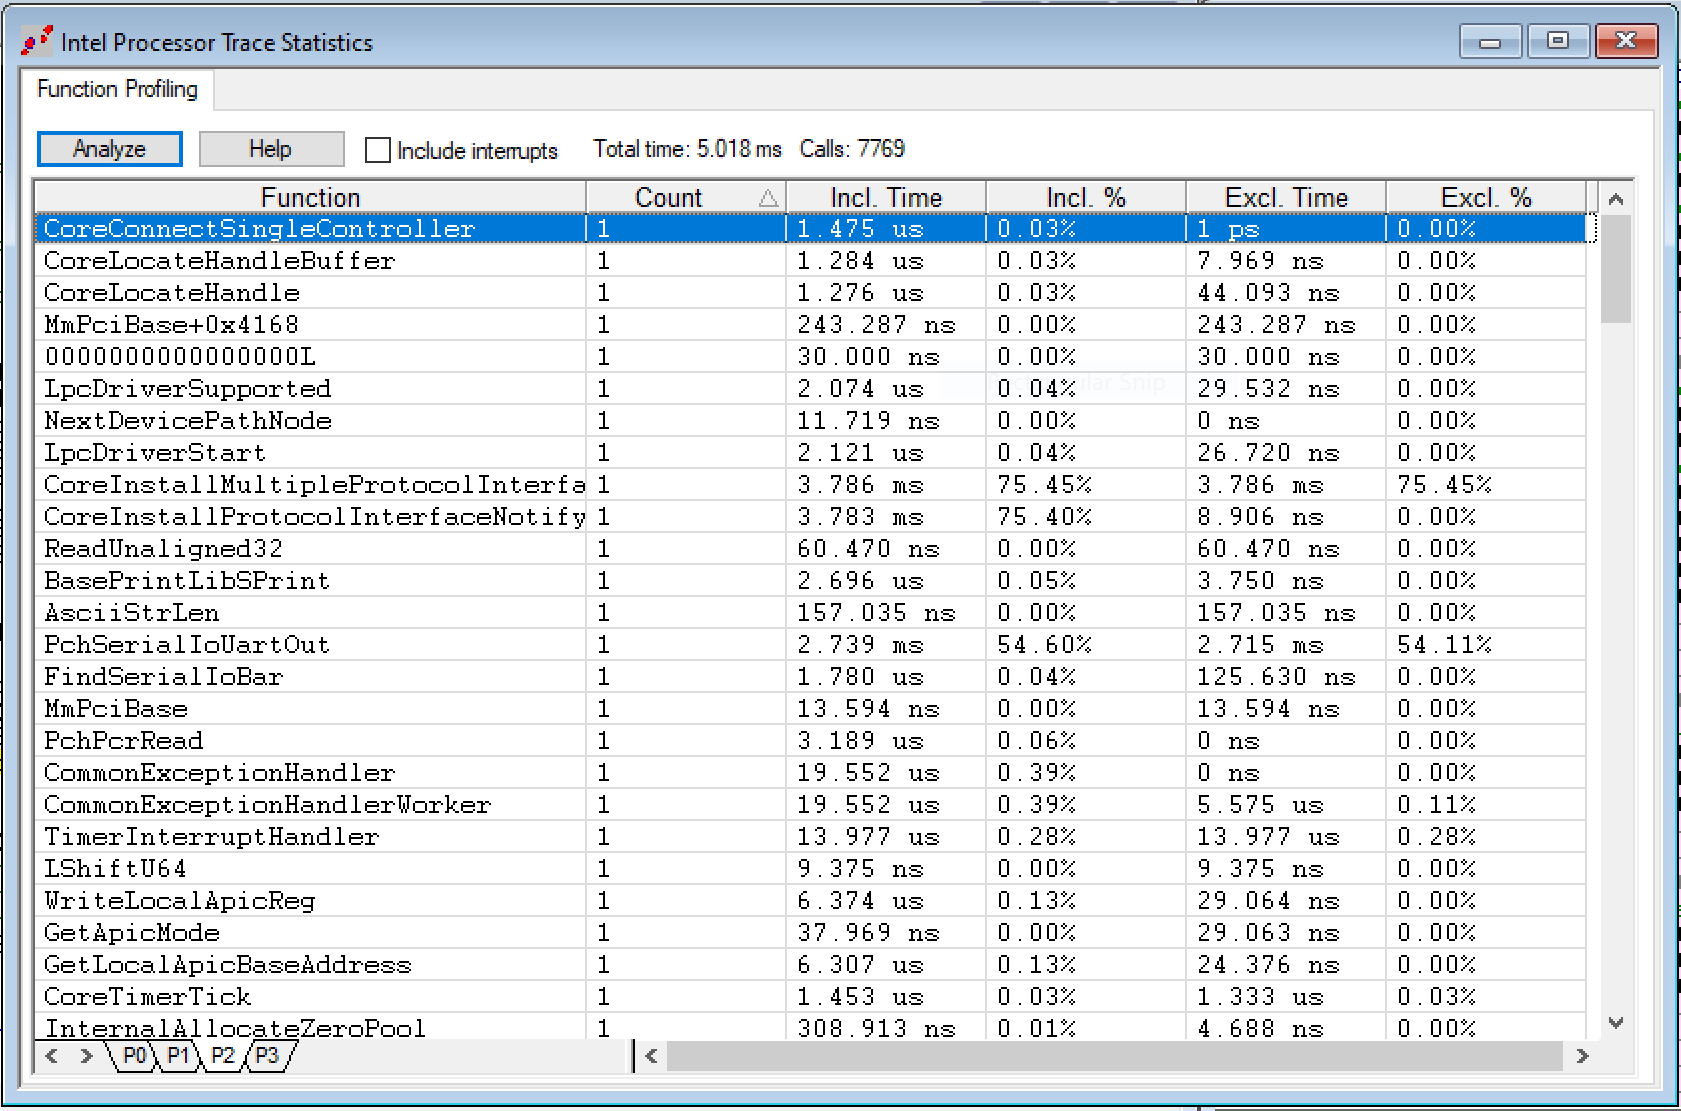
If you right-click inside the Intel Processor Trace window, and click on Open Trace Statistics Window, and then hit Analyze, you get a profile of the function calls, including Incl. Time (the total execution time in this function, including child calls) and Excl. Time (excluding child calls):
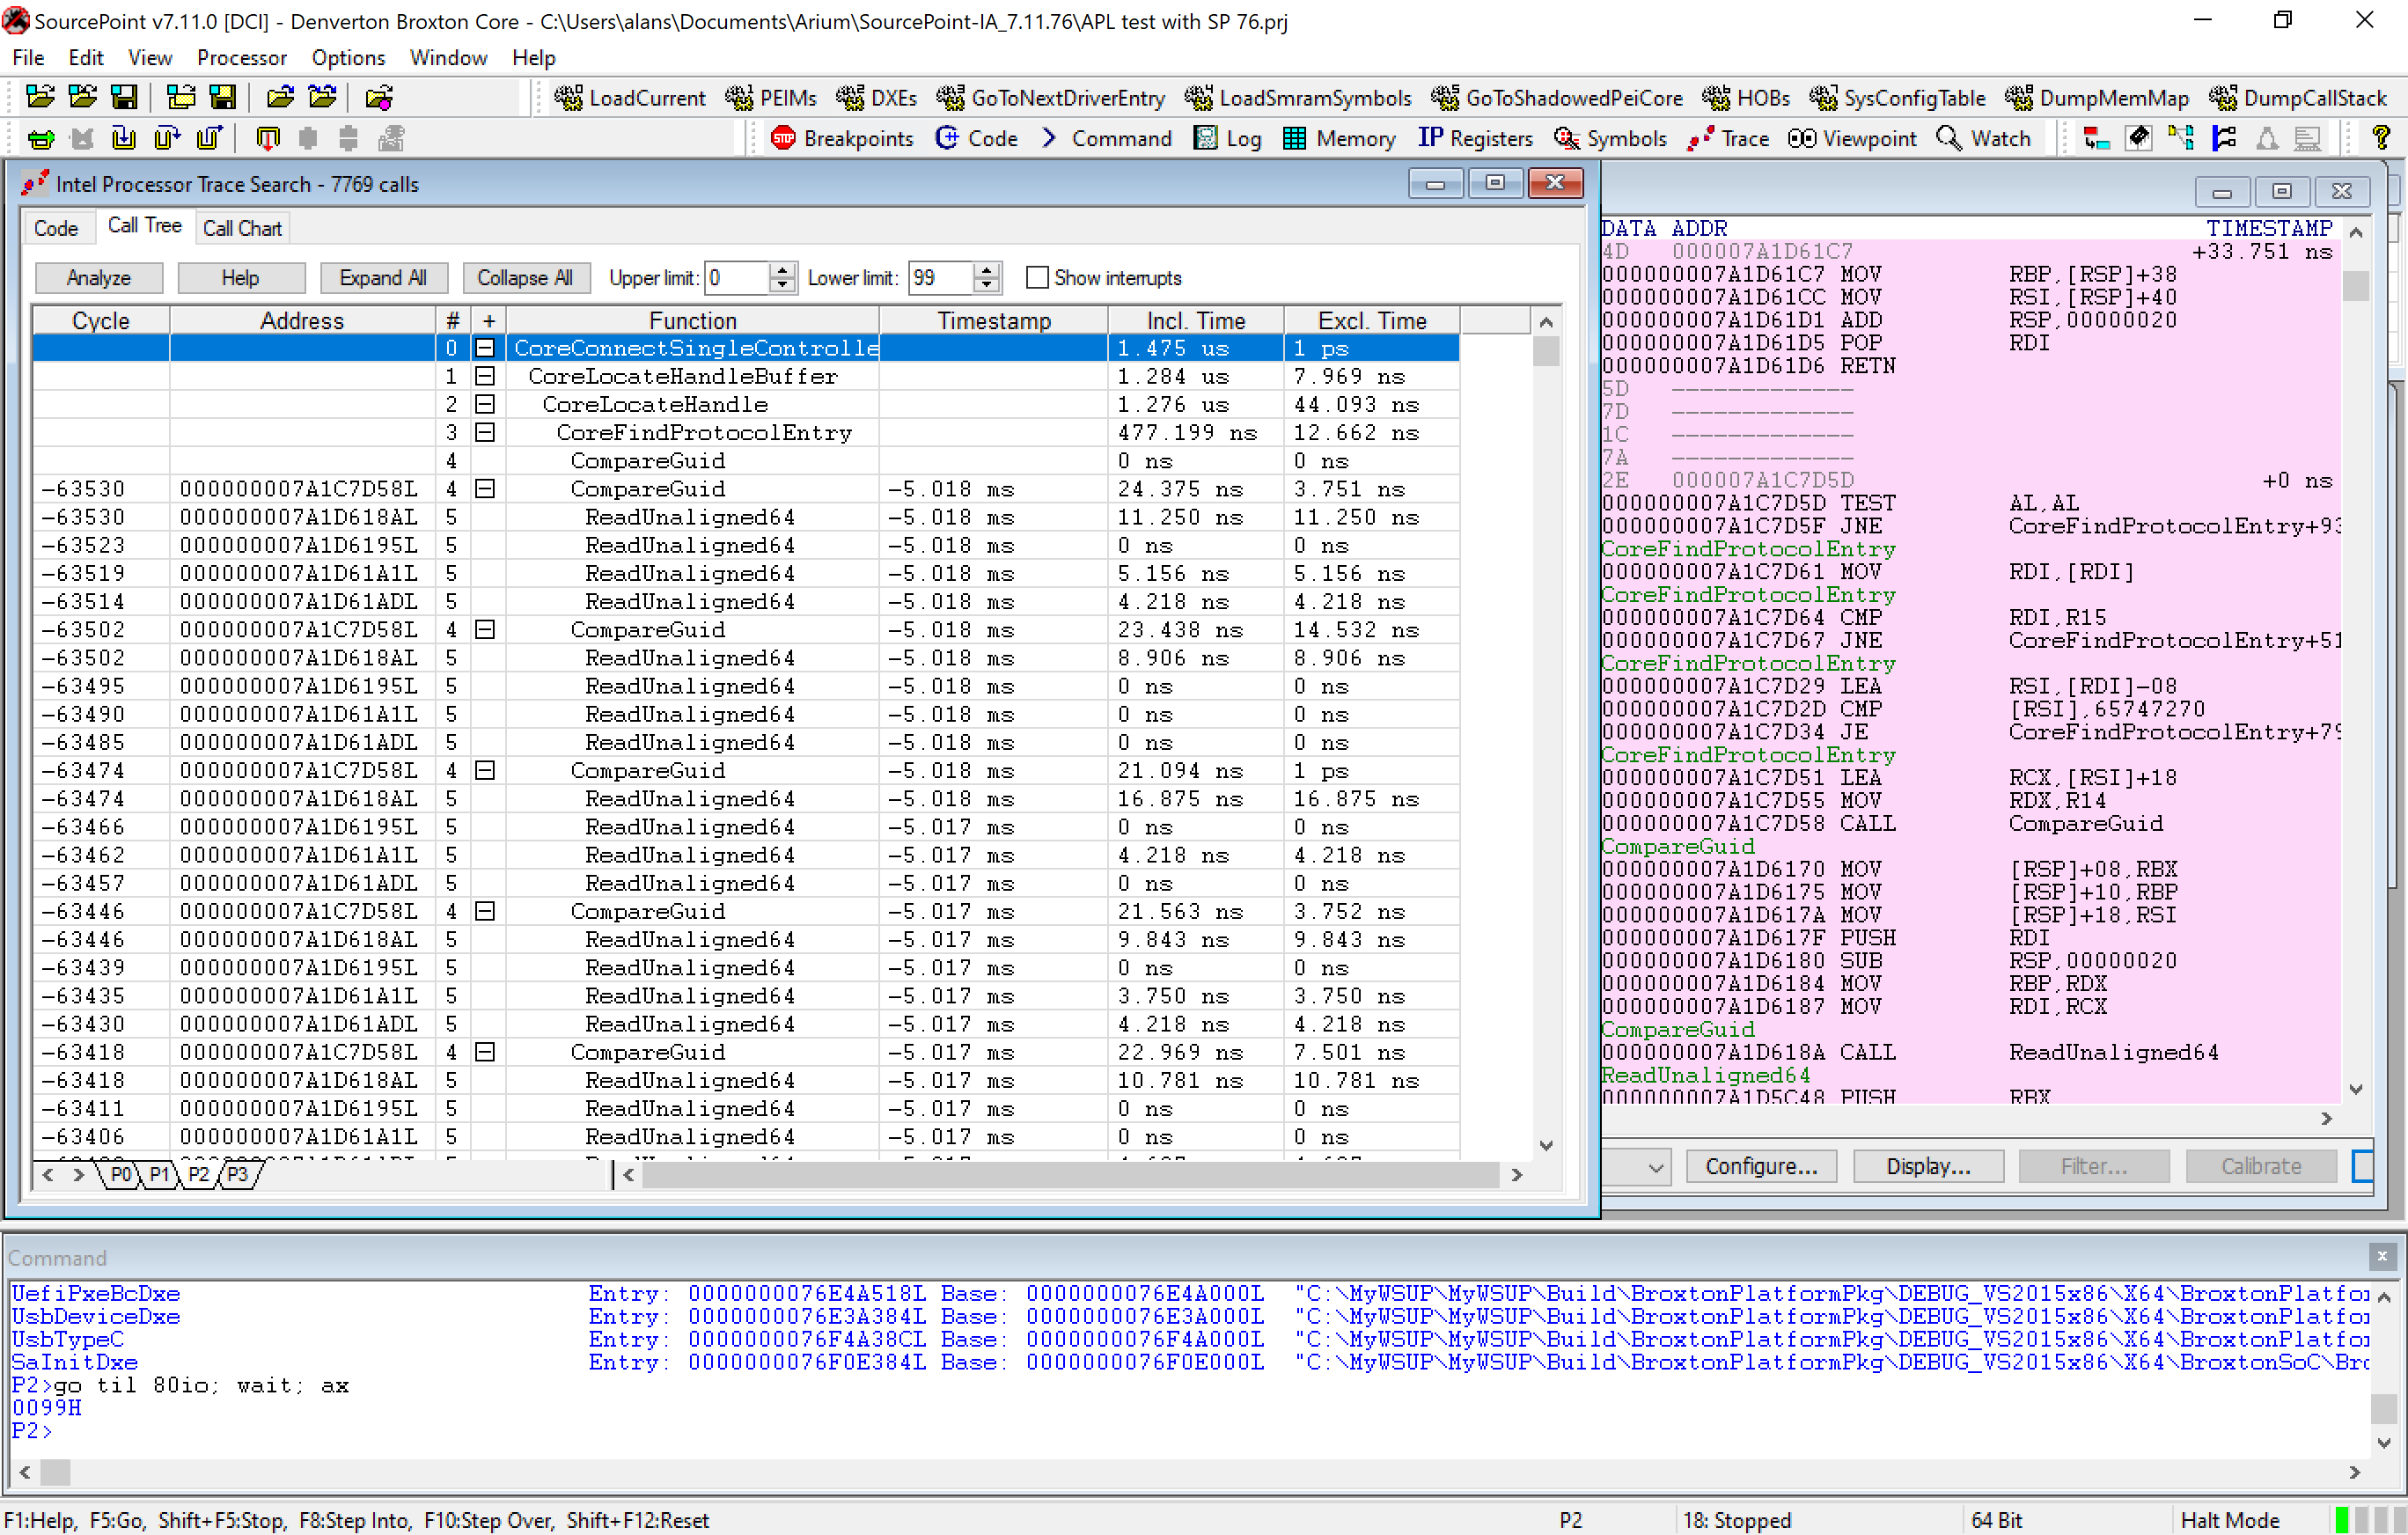
Right-clicking inside the Intel Processor Trace window, selecting Open Trace Search Window, and then clicking on Call Tree gets us a nested view of the function calls:
Finally, clicking on the Call Chart tab gives us this:
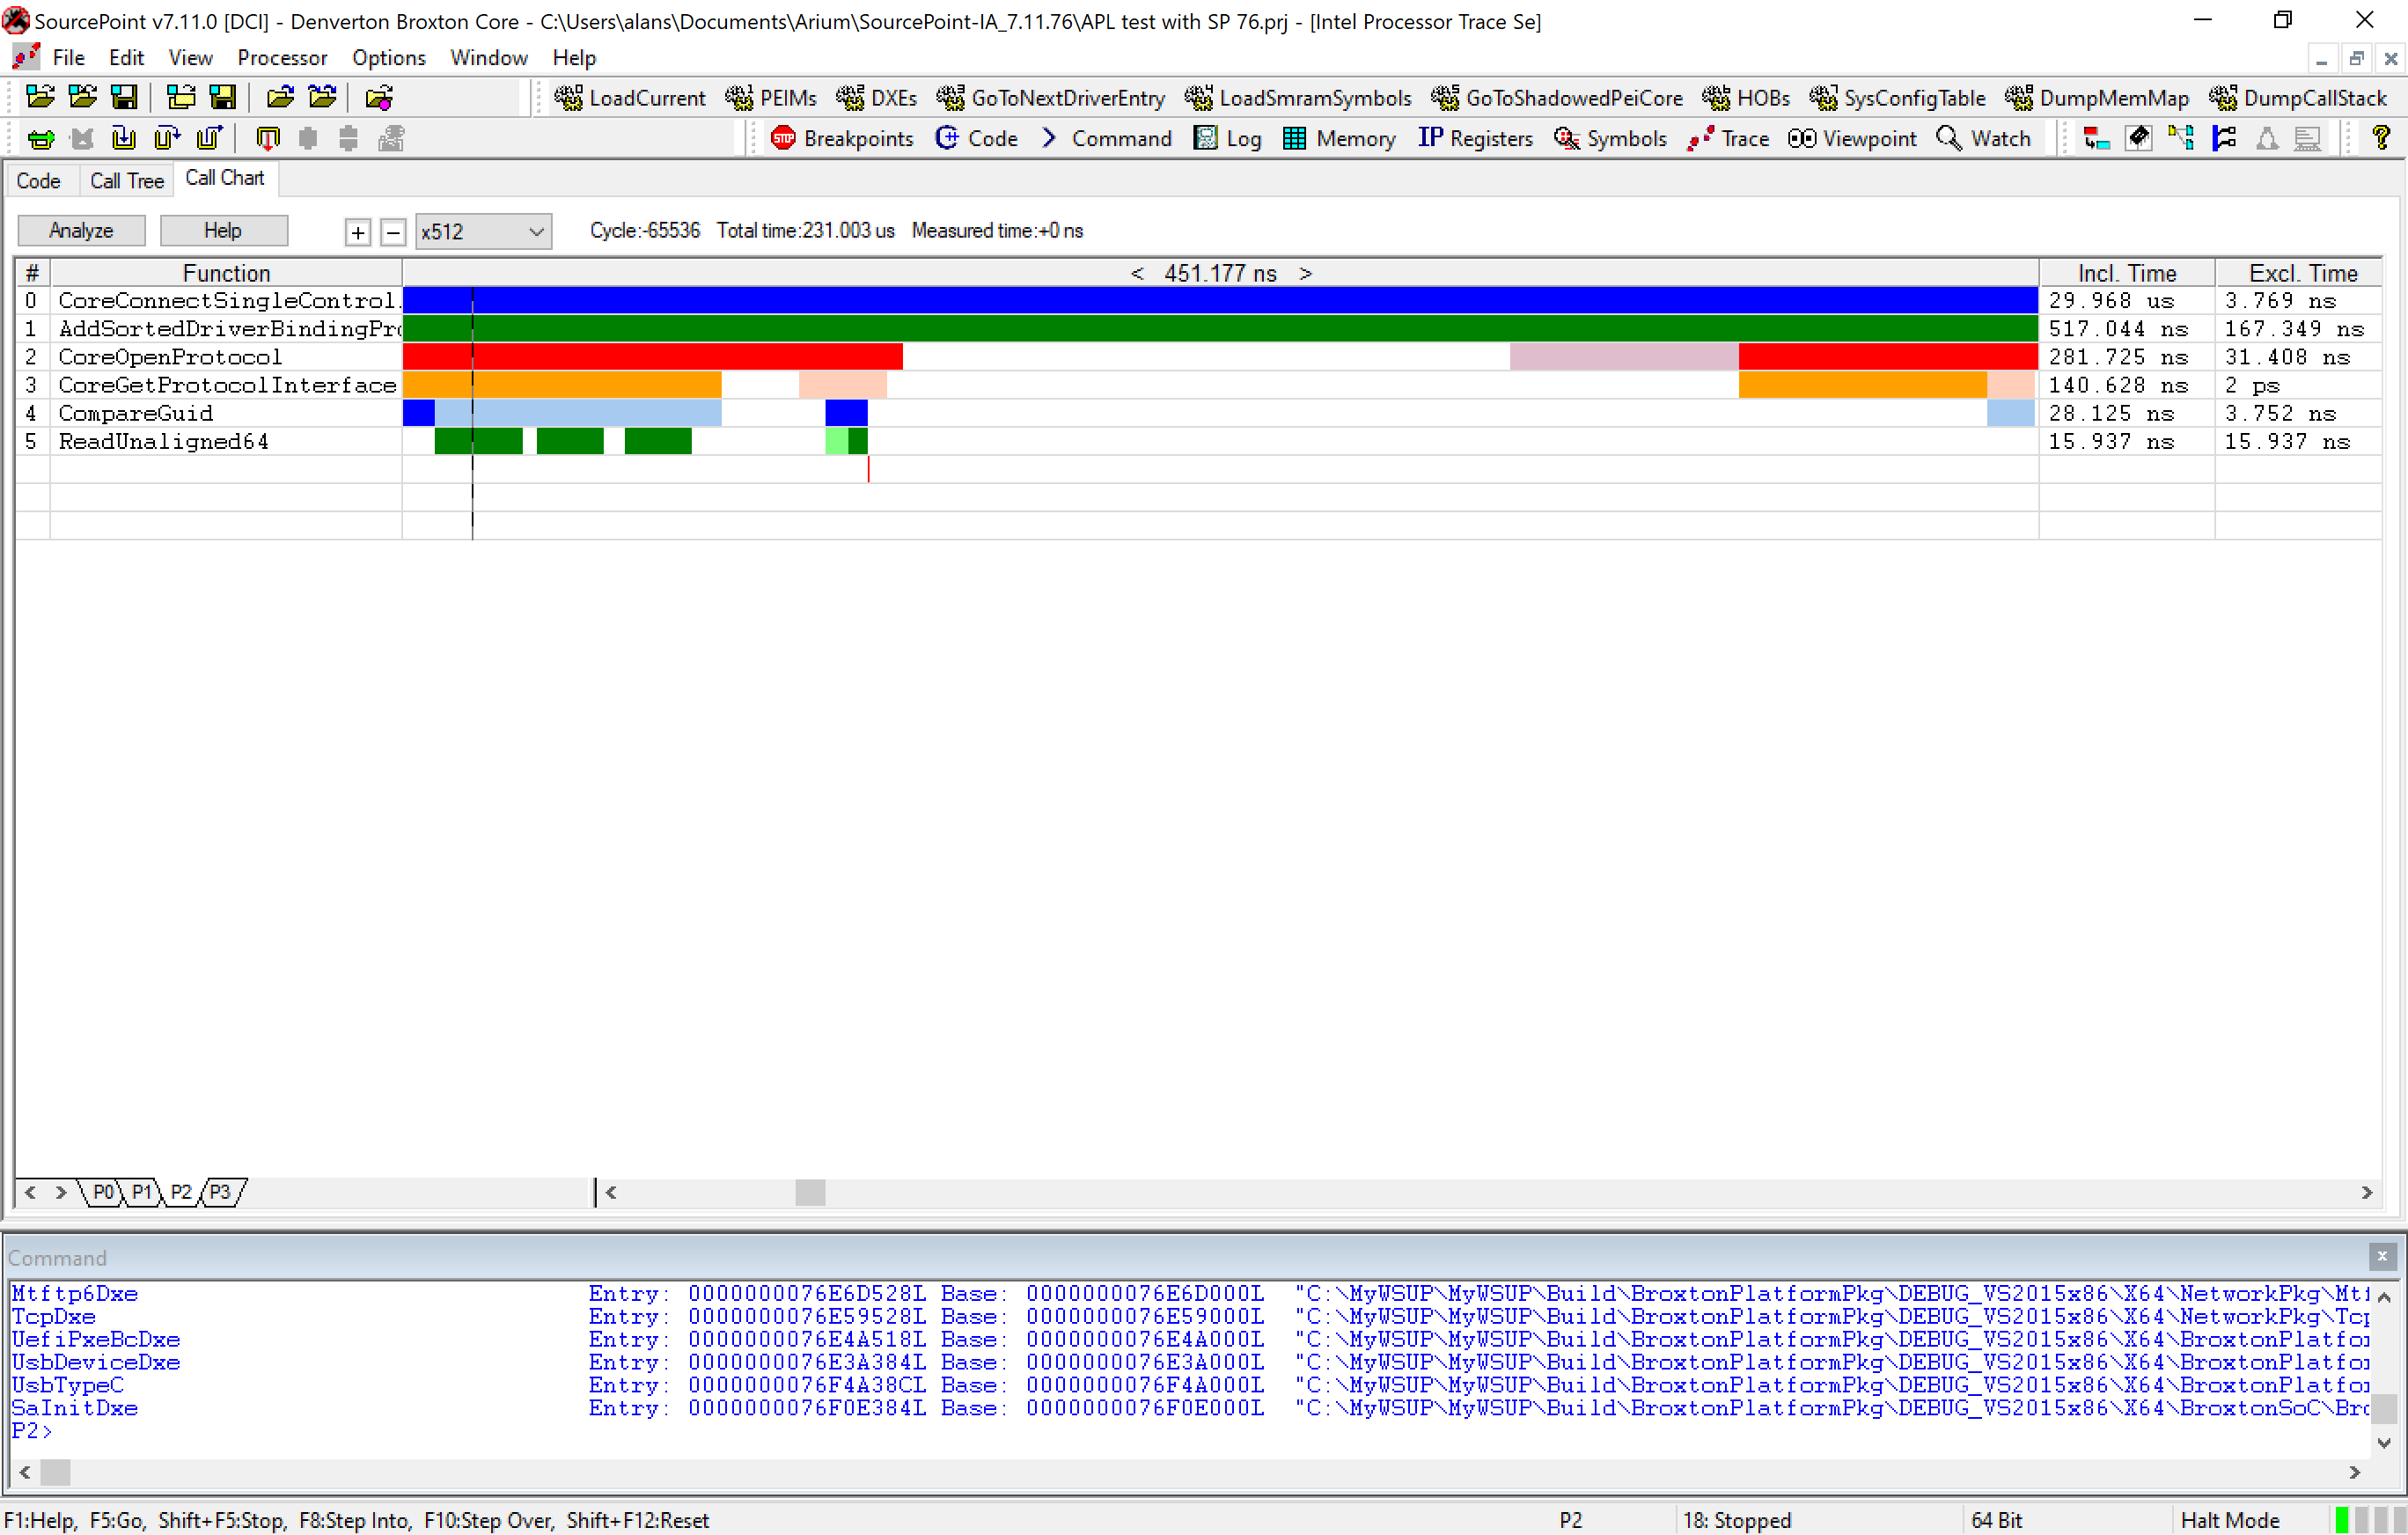
The dotted line to the left represents where the instruction pointer is; moving to the right gives us the history of instruction execution going back in time.
That is zooming in, and we see code execution over 451.177ns. Zooming out to the maximum, we see all 231.001 microseconds of code execution captured:
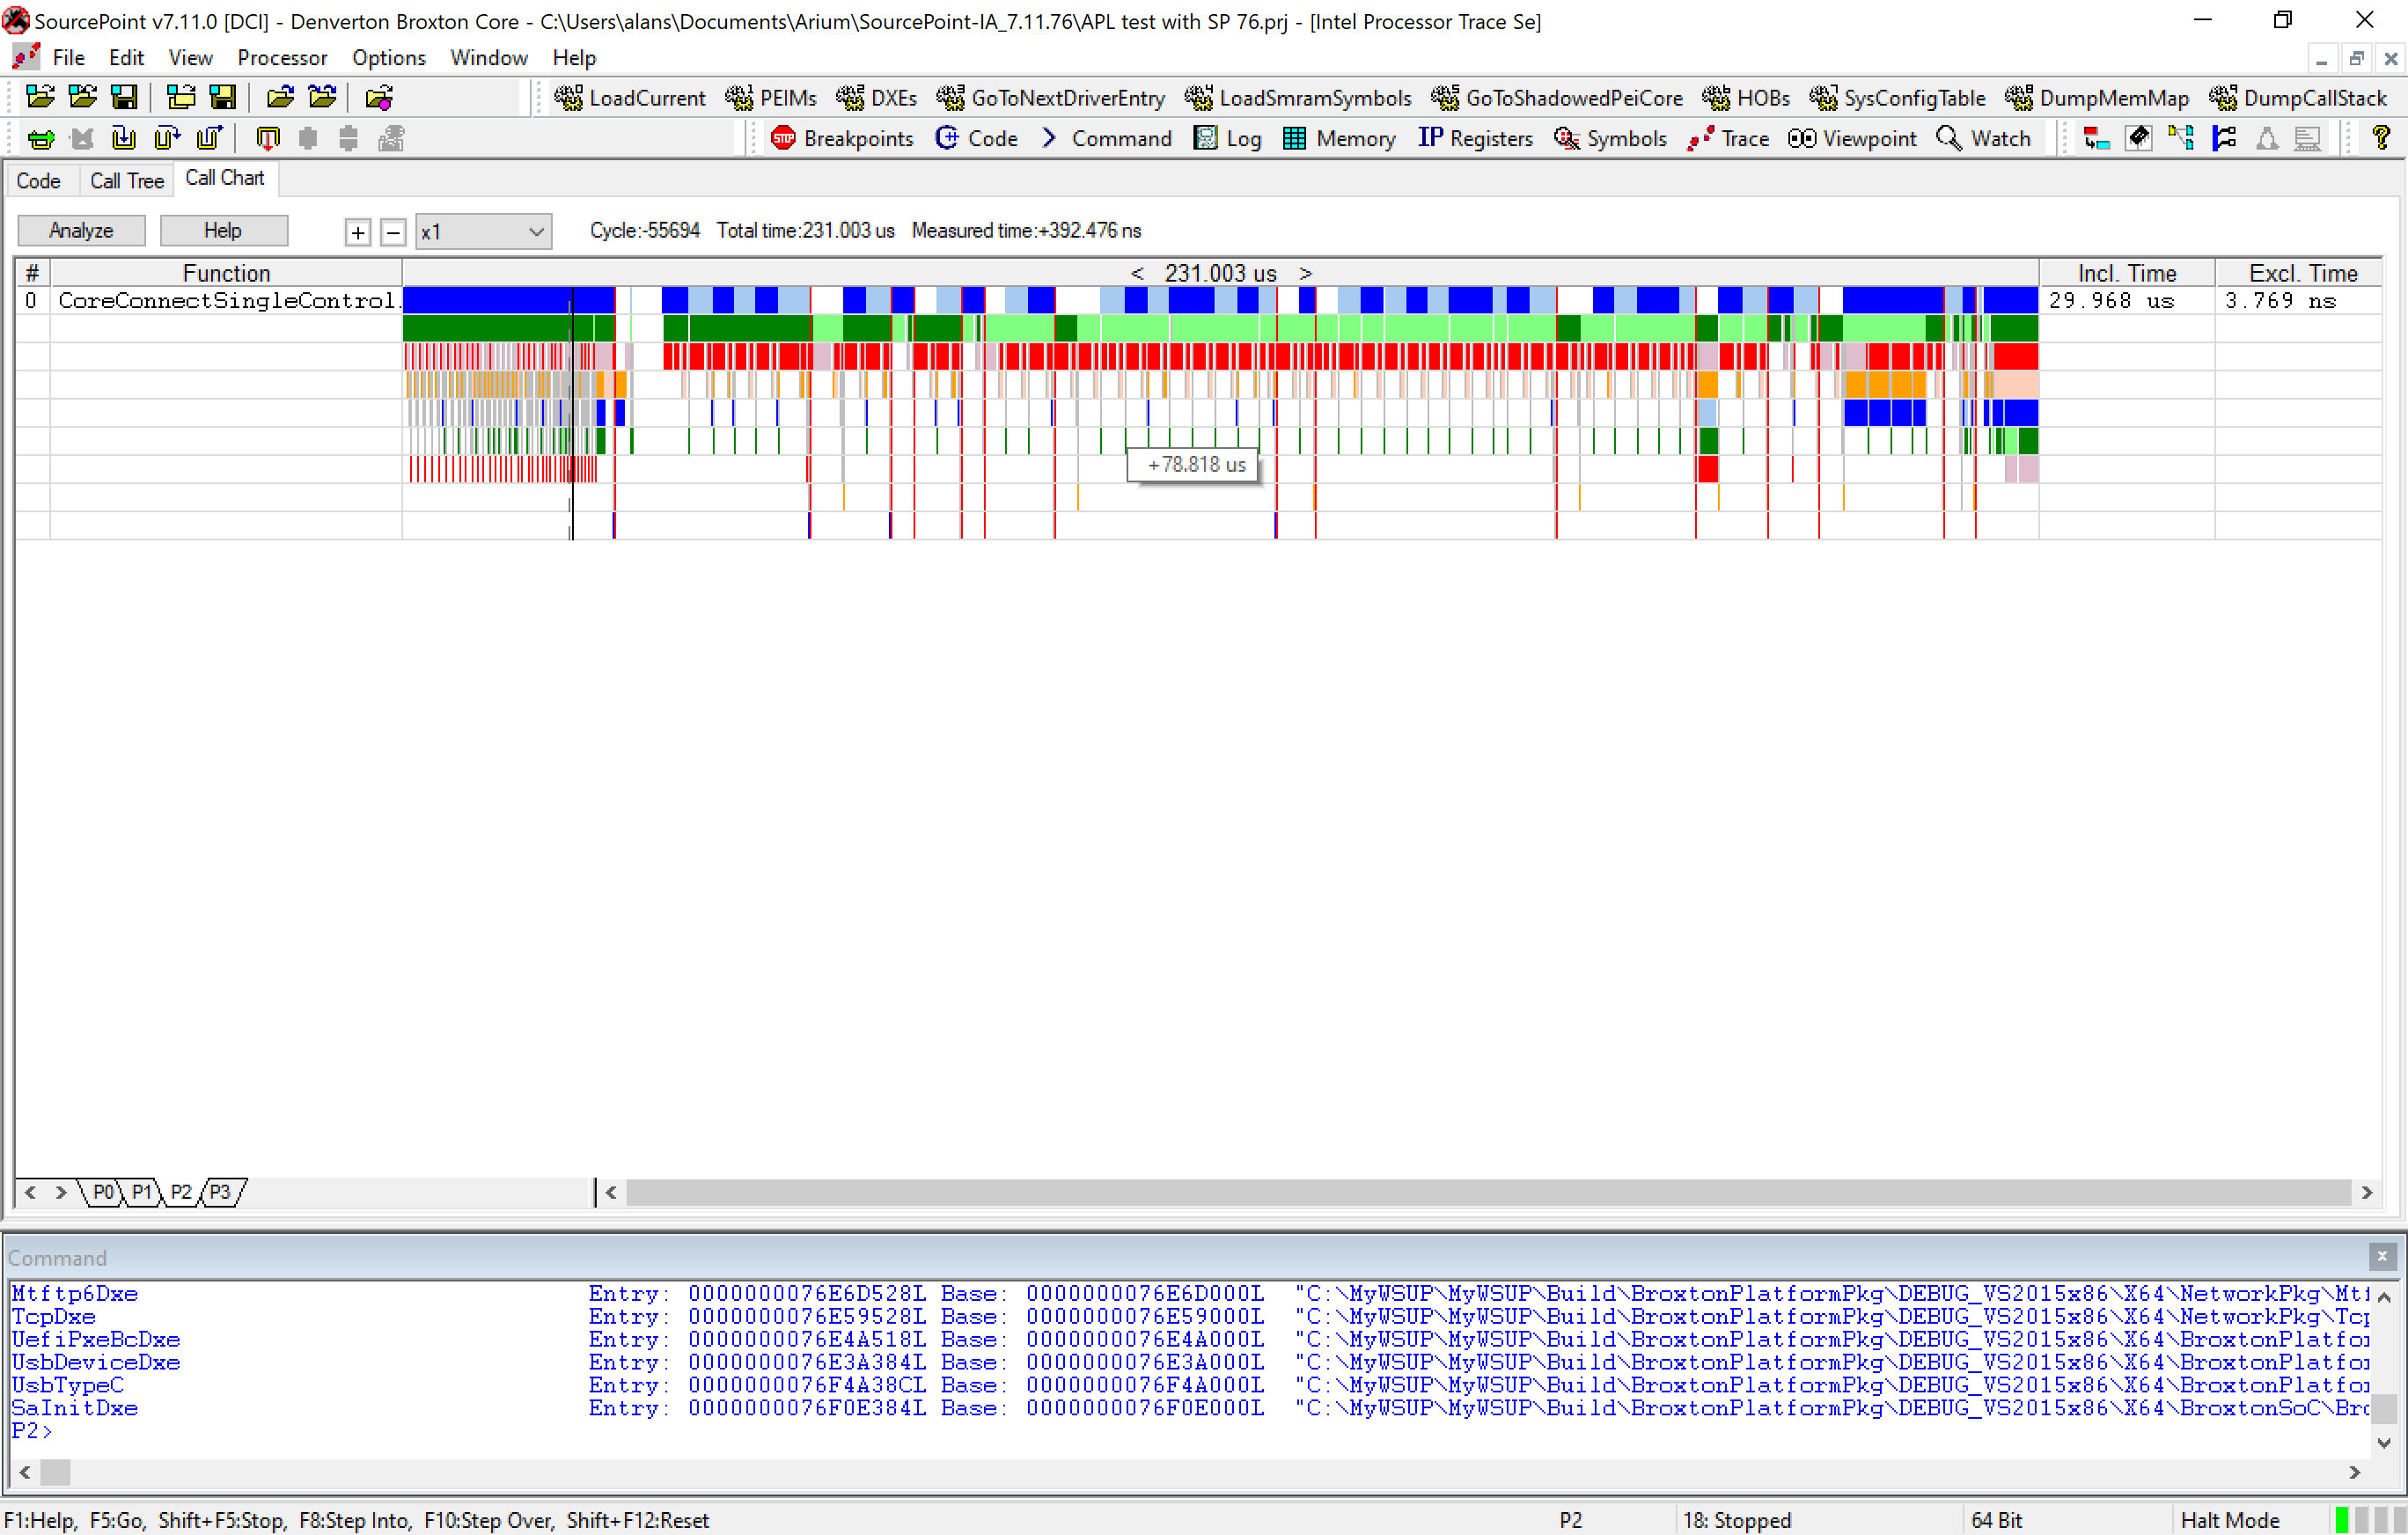
Moving the instruction pointer dotted line, either with the arrow keys or just clicking at various points in the trace history, allows us to “blow up” and closely examine code flow in the entire trace memory buffer, that was assigned to 64kB in the initial configuration.
I’ll write about more examples of Instruction Trace on the UP Squared later. It’s a very powerful tool as part of an overall Apollo Lake debug effort.