There have been numerous investigations into the use of the Performance Monitoring Counters (PMCs) for malware detection. Below is a quick survey of what I’ve read so far, as well as an investigation into using JTAG as an alternative access mechanism to traditional ring 0 or restricted OS mechanisms.
Performance monitoring events are used by performance profiling tools, e.g., the Intel® VTune™ Profiler, that provide event-based sampling microarchitecture analysis. This helps developers understand how effectively their code uses hardware resources, allowing for performance tuning.
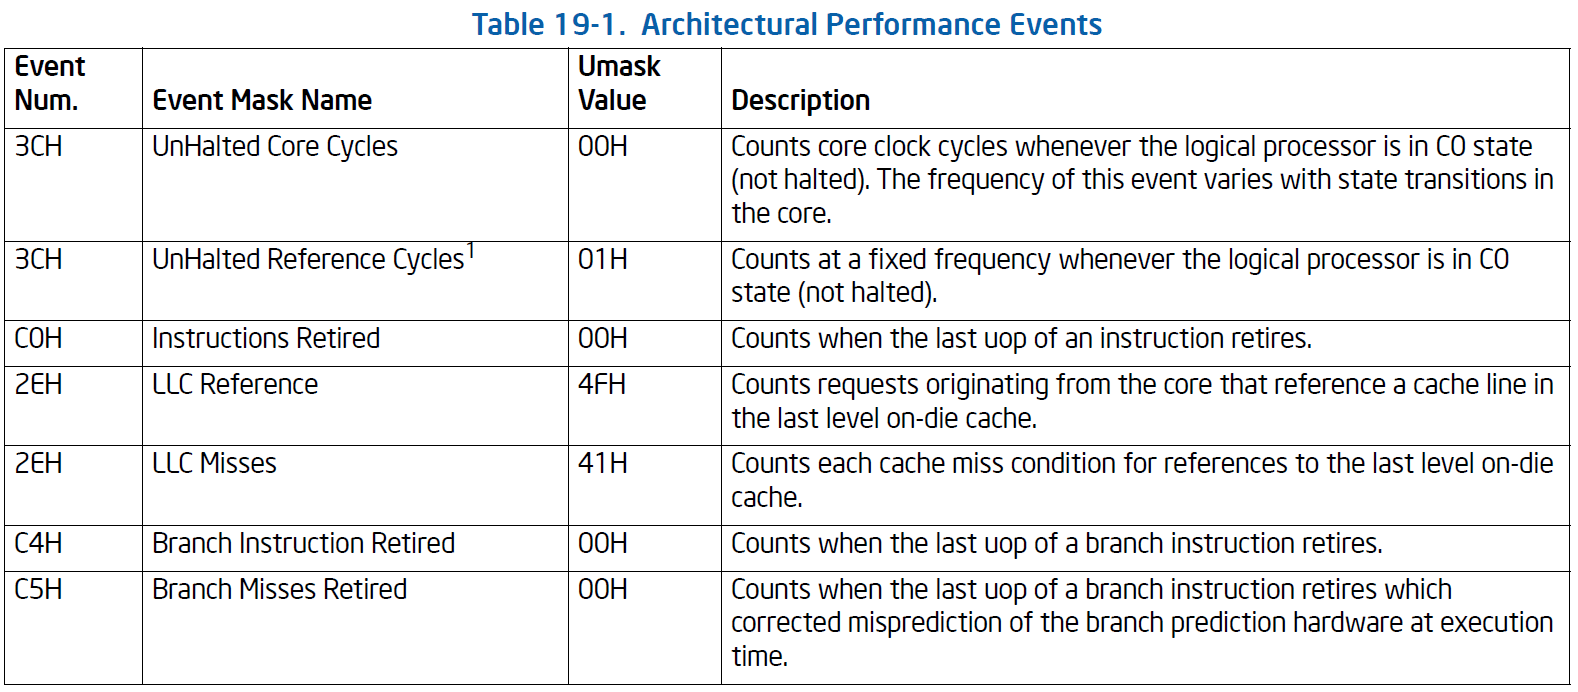
These performace monitoring events are supported by performance monitoring counters, of both the architectural and model-specific type. The best detailed description of Performance Monitoring is in Volume 3, Chapter 19 of the Intel Software Developers Manual. The architectural performance events are as follows:

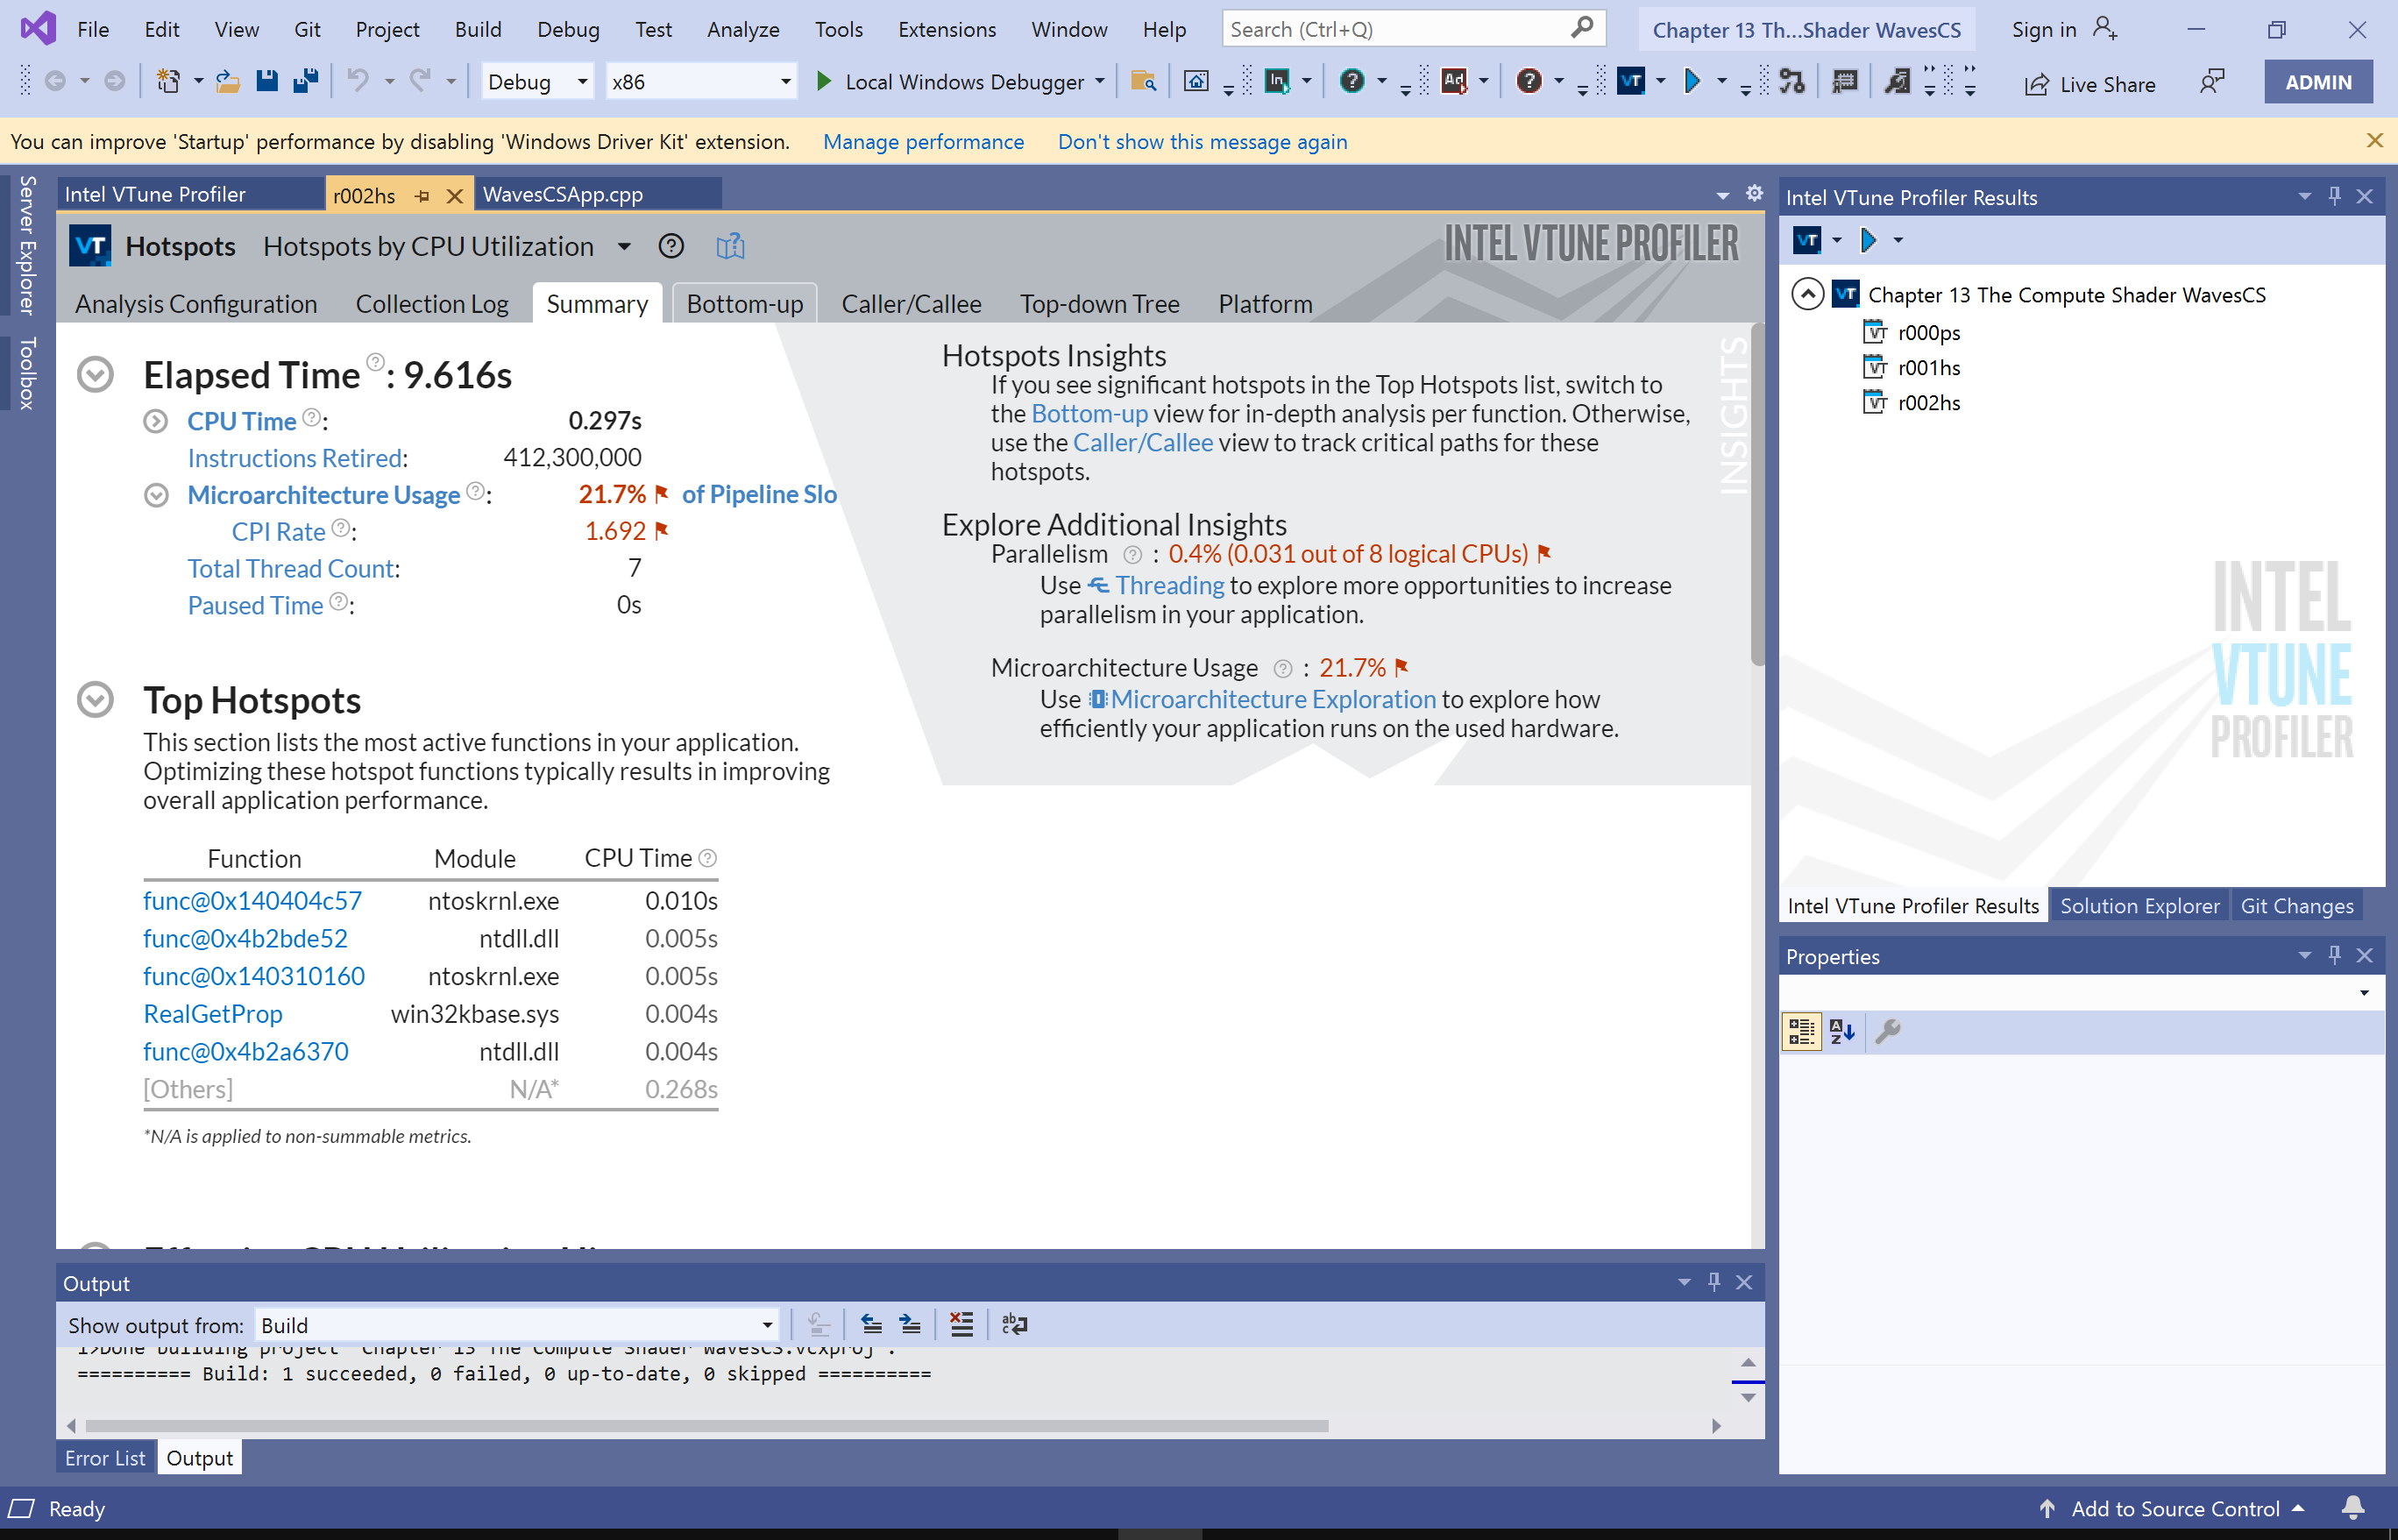
I’ve played with Intel VTune, one of the popular applications to use the performance counters, as part of some game code examples within the Game Engine Architecture tome by Jason Gregory:

From above, a “Hotspot” screen shows CPU utilization, based upon instructions retired. But, not being a hardcore game developer, I’ve not had cause to delve into it much. But, there’s obviously a lot of power in the tool.
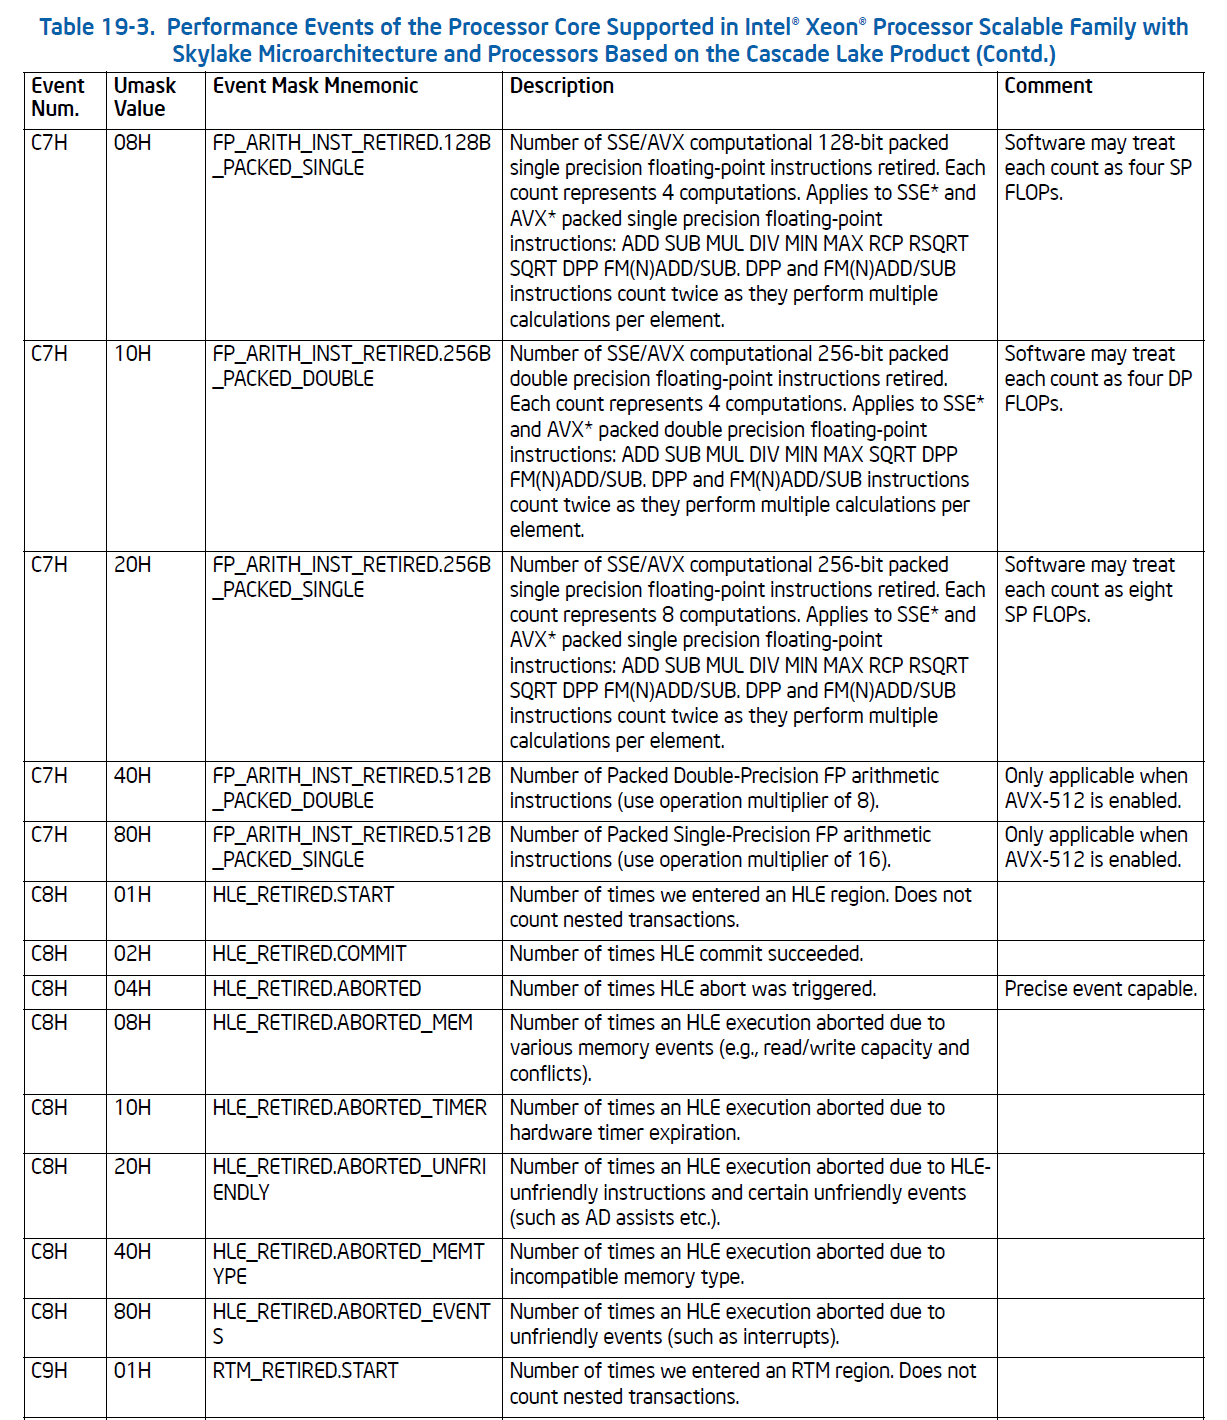
The model-specific events, of course, vary by Intel CPU, and there are literally hundreds for the latest server CPUs. A small excerpt from the SDM is as follows:

This presents an extremely flexible foundation not only for performance tuning, but also for cybersecurity research.
When I first started looking into this, the 2015 Black Hat paper by Nishad Herath and Anders Fogh caught my eye: These are Not Your Grand Daddy’s CPU Performance Counters: CPU Hardware Performance Counters for Security. A fascinating paper, it explored the possibilities of using the PMCs to detect and possibly assist in the mitigation of a number of different attacks:
- Return Oriented Programming (ROP)
- Rowhammer
- Rootkits
- Cache side channel attacks
I won’t repeat the contents of the paper here, but do recommend it for reading.
I have read a number of associated papers, and at the opposite end of the spectrum is the academic paper A Cautionary Tale About Detecting Malware Using hardware Performance Counters and Machine Learning, by Zhou, Gupta, Jahanshahi, Egele and Joshi. The premise of this work is that there is no correlation between low-level microarchitectural events and high-level software behavior.
I’ll leave it to some future work to keep reading on this topic and determine the efficacy of the PMCs for cybersecurity research.
It did occur to me, though, that instead of taking advantage of services that exist in ring 0, with the associated performance impact and risk thereof, one could use JTAG to read the performance counters. As the PMCs are inherently MSRs and thereby architecturally visible registers, they could be accessed out-of-band (accessible via the debug logic within the CPU) by JTAG. If this were the case, and the registers could be accessed without halting the target (often a staple of JTAG-based access), the power of the PMCs could be multiplied.
As it turns out, later Intel server silicon supports CPU logic that provides for this facility: the Out-Of-Band Management Services Module (OOB MSM). For more information on this service, read my blog Coding to the SED API: Part 5.
Within our SourcePoint and ScanWorks Embedded Diagnostics (SED) products, access to the Python CLI to retrieve the value, for example, of the MSR_PLATFORM_INFO MSR is done by the following example sequence of commands:
>>> itp.isrunning()

True

>>> sv.socket0.uncore.getaccesschoices()

{'default': ['pcicfg',

'default',

'msr',

'oobmsm',

'tap2sb',

'mem']}

>>> sv.socket0.uncore.setaccess('oobmsm')

>>> sv.socket0.uncore.getaccess()

'oobmsm'

>>> sv.socket0.uncore.searchaddress(msr_offset=0xce)

['punit.platform_info_cfg',

'punit.platform_info',

'uncore_msr.pcu.punit.platform_info']

>>> sv.socket0.uncore.punit.platform_info_cfg

0x8082ffb811600
And, by invoking the SED API directly down on the BMC, this capability can be invoked bare-metal and at-scale.
I’ll write more on this topic later. In the meantime, a primer on SED is available here.


