
In this installment, we’ll look at the SED functions that access the OOBMSM, and use it for super-fast retrieval of hardware telemetry data.
The Out-of-band Management Services Module (OOBMSM) is a logic block embedded within the latest Intel platforms (in this article, we’ll talk about Whitley, or Ice Lake server, now past the line of demarcation and known as one of the 3rd Gen Intel® Xeon® Scalable processors; but it spans both server and client). The OOBMSM is a building block component of Intel’s Platform Monitoring Technology (PMT); you can read more about PMT at Intel Platform Monitoring Telemetry Appears Destined For Linux 5.10 and Intel Platform Monitoring Technology Is Supported By Linux 5.11. An excerpt summary of PMT from the great Linux e-magazine, lwn.net is as follows:
Intel Platform Monitoring Technology (PMT) is an architecture for enumerating and accessing hardware monitoring capabilities on a device. With customers increasingly asking for hardware telemetry, engineers not only have to figure out how to measure and collect data, but also how to deliver it and make it discoverable.
PMT could make a topic for a whole separate series of articles. However, today, we’ll focus on the OOBMSM. It was originally designed as a complementary technology to extract key architectural data out of a platform that is in either a running state or a “wedged”, hung or crashed state. OOBMSM access is complementary to run-control, the JTAG- and sideband-signal-based mechanism for accessing x86 registers, system memory and I/O that puts a system into probe mode and effectively “halts” it. Halting a platform has some obvious disadvantages: although very helpful in dumping data out of a crashed system (i.e. the OS/firmware is locked up, but the processors themselves are sane), it can’t be used if the Intel CPU is totally locked up (i.e. in an internal error or IERR state) and not even responsive to the sideband signals. And it of course run-control can’t be used if the desire is to conduct data transactions on a running CPU.
OOBMSM data extracted is a subset of that obtainable via run-control. Specifically, and of interest here, it can pull out machine check and CPU and downstream PCI configuration/MMIO data. That, and its ability to work with wedged CPUs, make it very powerful. Generally, on autonomous BMC agents, if only the above data is required to be extracted, OOBMSM data can collected using Input Output Sideband Fabric (IOSF) access, which is ~2.4X faster than raw JTAG. We’ll see more about this in a minute.
The OOBMSM can be accessed via either Platform Environment Control Interface (PECI) and JTAG. As both of these interfaces are typically equipped on BMCs, these service processors can be used as autonomous crash dump collection agents, if equipped with the needed firmware. The issue with PECI is, for one thing, its speed – it was originally designed as a single-wire out-of-band thermal management technology, and thus operates fairly slowly – typically 10X slower than JTAG. And, it has a tendency to be less robust than JTAG, which is the underlying access fabric to the IOSF.
On servers, crashdump utilities have been written by ASSET to extract wedged system data using JTAG. These utilities are generically named On-Target Diagnostics (OTDs). These OTDs use the IOSF functions available within the SED API library. For example, as an excerpt out of our SED API Reference Manual, here is a list of some of these functions:
ai_mIOSFcrashdumpDiscovery

ai_mIOSFreadEndpointConfig

ai_mIOSFreadMSR

ai_mIOSFreadPCIConfig

ai_mIOSFreadPCIConfigLocal

ai_mIOSFreadPkgConfig

ai_mIOSFTAPinit

ai_mIOSFTAPownership

ai_mIOSFwritePCIConfig

ai_mIOSFwritePCIConfigLocal

ai_mIOSFwritePkgConfig
These are used within our JTAG-based Autonomous Crash Dump (JACD) utility. This application runs ~10X faster than the PECI version, enabling either a faster return-to-service of the afflicted node, or optionally a much larger data collection for telemetry services.
For interest, below is an excerpt out of the JACD main routine:
int main(int argc, char* argv[])

{

    int iError;

    std::string onDemandLogContents;

    std::ofstream myfile;

    crashdump::outputFilename = "/tmp/ai-cdump.json";  //User -f argument may override filename

    iError = parseArgs(argc, argv);

    if (iError != 0)

    {

        usage();

        return iError;

    }

    myfile.open (crashdump::outputFilename);

    crashdump::initCPUInfo(crashdump::cpuInfo);

    crashdump::getCPUData(crashdump::cpuInfo, cpuid::STARTUP);

    std::string onDemandTimestamp = crashdump::newTimestamp();

    crashdump::newOnDemandLog(crashdump::cpuInfo, onDemandLogContents, onDemandTimestamp);

    myfile << onDemandLogContents;

    myfile.close();

    return 0;

}
You can see from our webinar, At-Scale BMC-based debug of x86 servers, about 45 minutes into the demo, that JACD dumps the contents of the cores, machine check architecture (MCA) registers, the entire uncore, table of requests (TOR), power management information (PM_info), and memory address map on the Ice Lake server platform I ran this on:
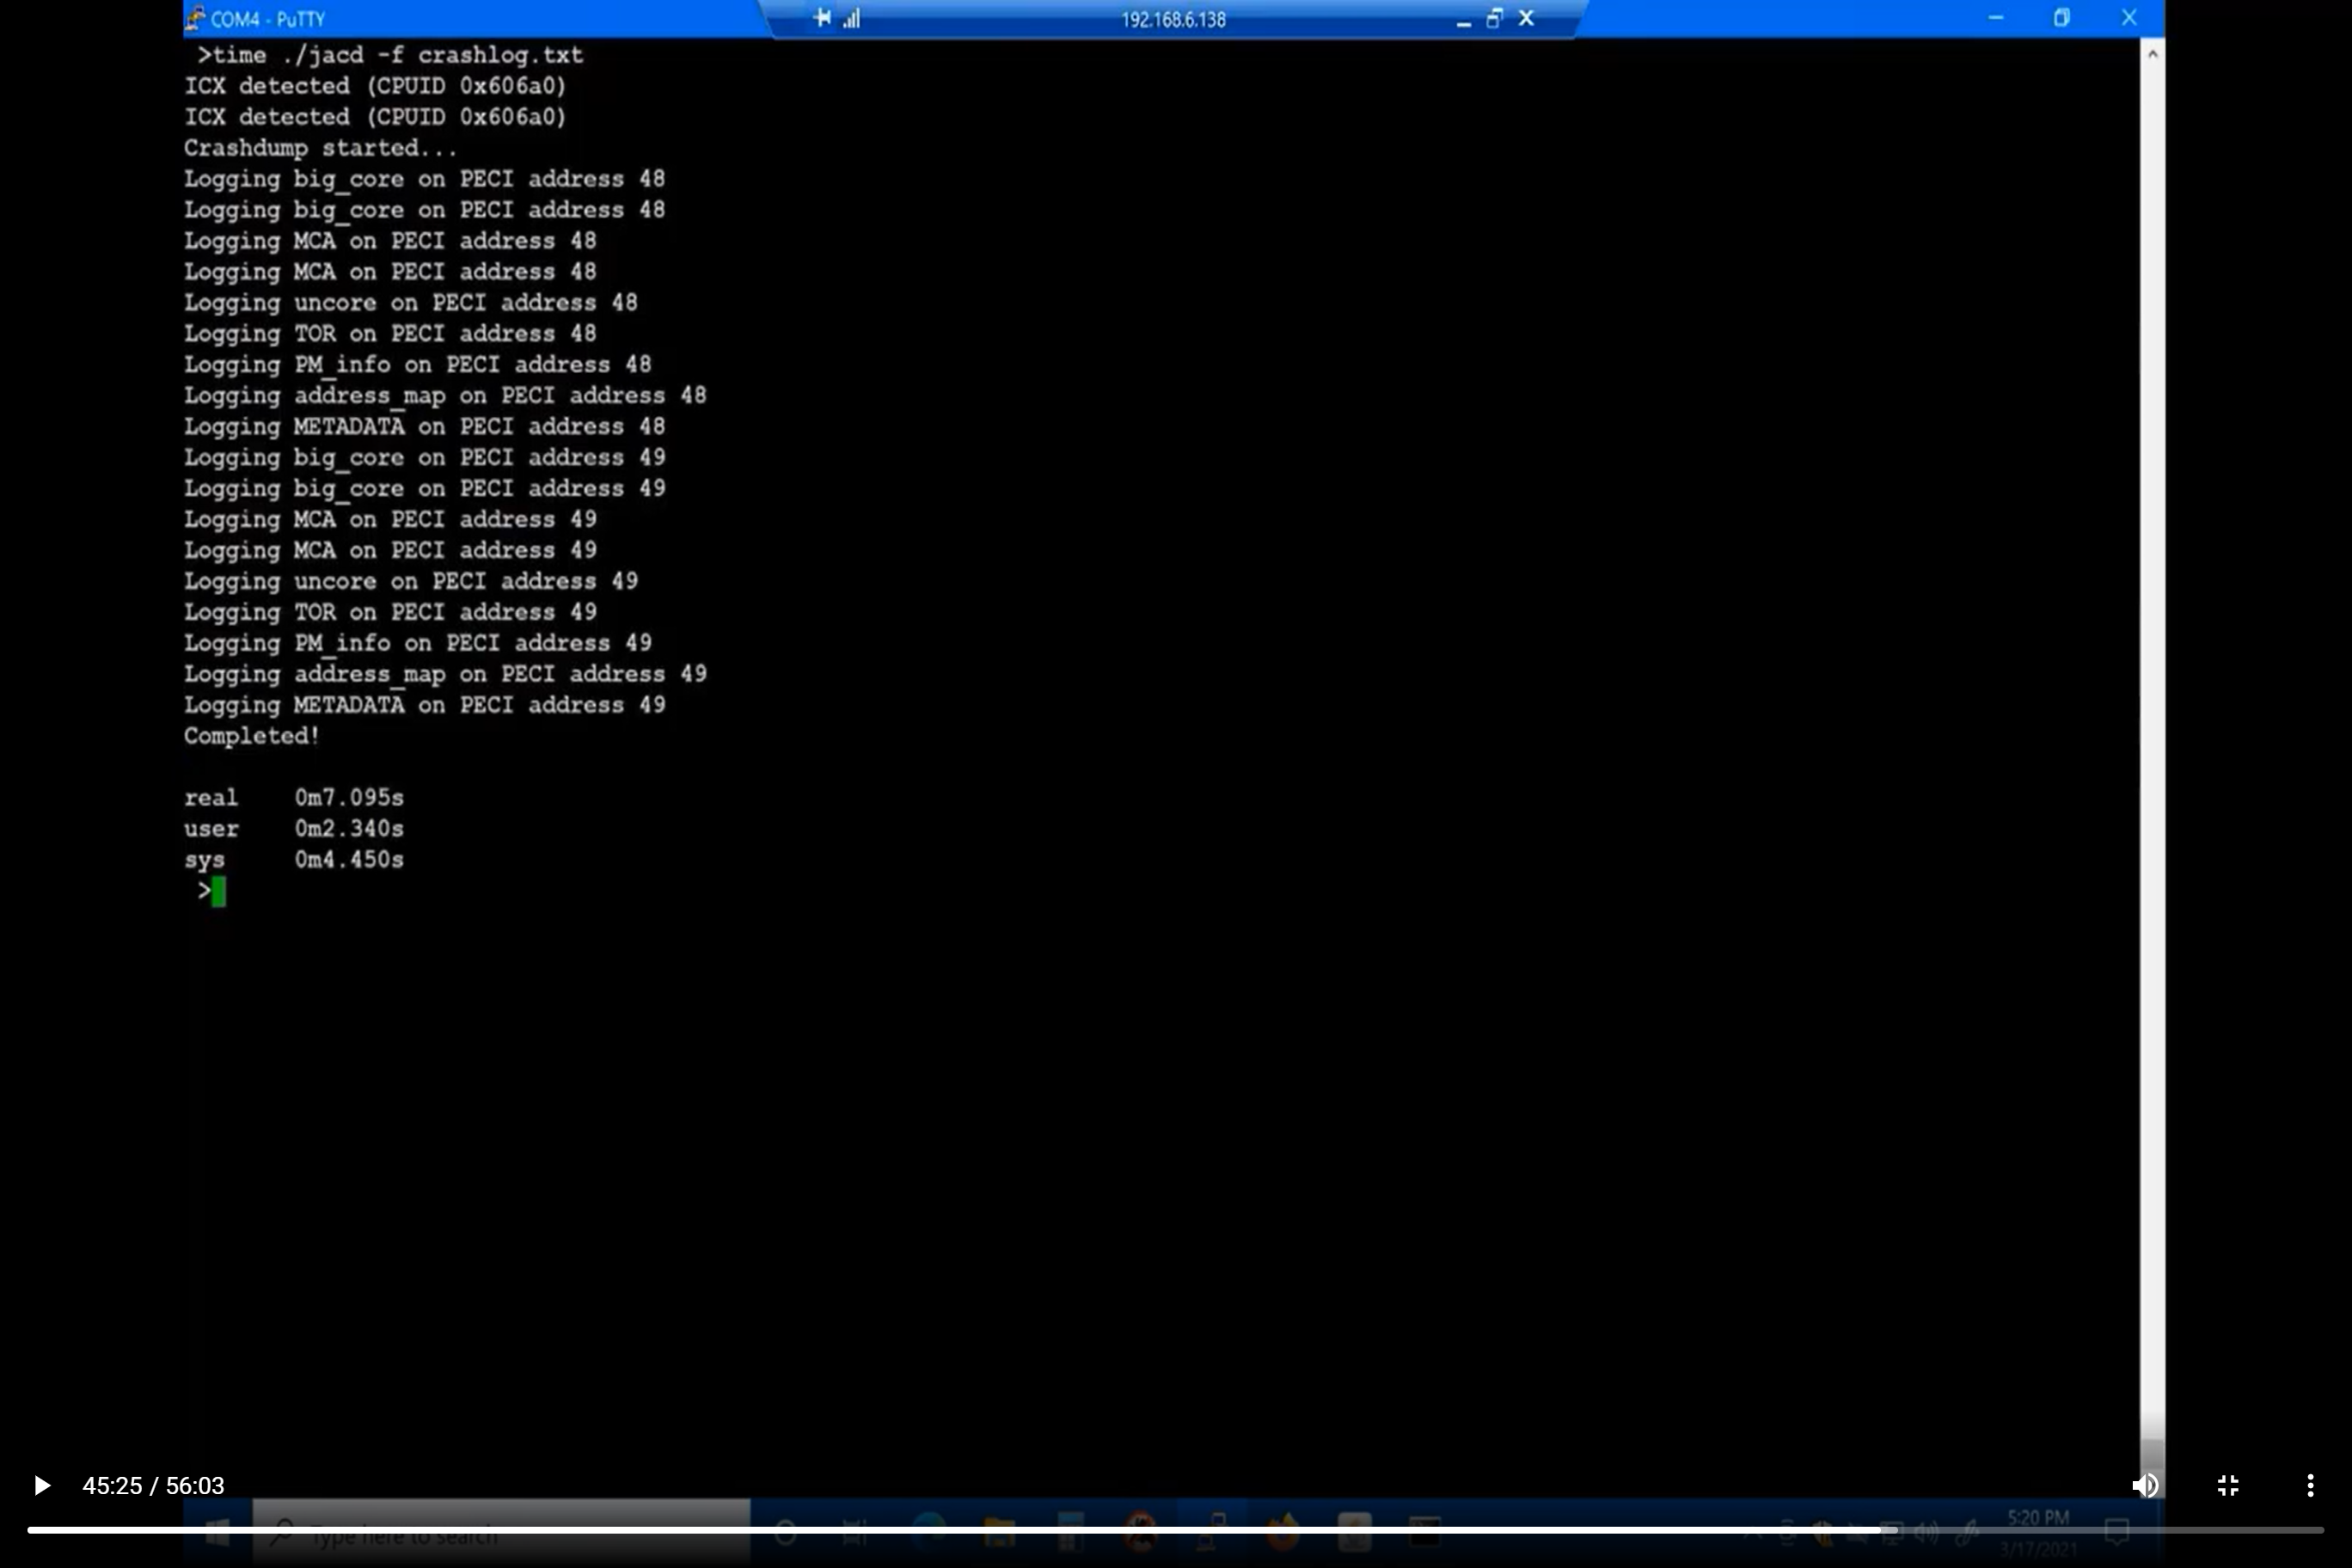
You can see how blazingly fast this is. To run the equivalent CScript could take hours.
For more background on the SED API, read the following articles:
Coding to the SED API: Part 1 – Introduction
Coding to the SED API: Part 2 – ltloop main event logic
Coding to the SED API: Part 3 – ltloop PCI config reads/writes
Coding to the SED API: Part 4 – libtest example for all JTAG run-control capabilities