Do you know how it feels when you have an itch, and you just have to scratch it? Well, after an extended hiatus from writing, I felt an overwhelming compulsion to do another MinnowBoard image build with source and symbols, do some more exploring, and then blog about it.
It always seems like this time of year is the time for household chores. Those, of course, take me away from what little time is available for my hobbies, such as tinkering with technology. And this year has been especially distracting: our 25-year old house has had just about everything go wrong with it that could go wrong. So, between work and household repairs, there hasn’t been a lot of time for fun.
Then, this weekend, I realized that I was caught up! Yes, I still had to walk the dog, have dinner with family friends, take the garbage out, and do all the other usual stuff; but I did manage to spend some time with my beloved MinnowBoard.
What I wanted to do most was to load the latest firmware on it. A lot of my earlier work (dating back to Episode 3, from January 23, 2017) was with Release 0.94. There have been numerous updates since then. The most current release is 1.00, dated November 2018. I wanted to explore this new release, and test it out with SourcePoint.
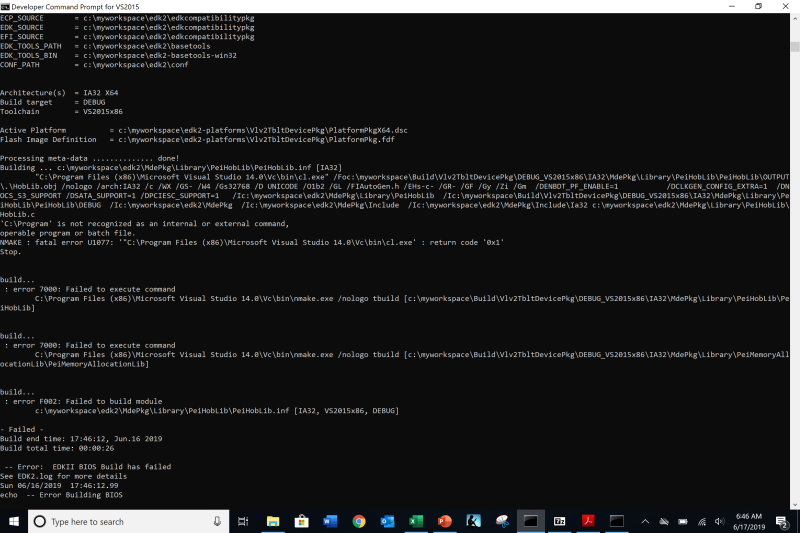
As before, I followed the instructions on Intel’s firmware site, in the Release Notes for Release 1.00. I did note that there were some subtle differences in the build process for this newest release, compared to the older versions. For one, we now use Visual Studio VS2015, as opposed to VS2013 before. This led to a head-scratcher for a period of time. Once I had the new version of Visual Studio installed, and followed the rest of the instructions, the build failed:
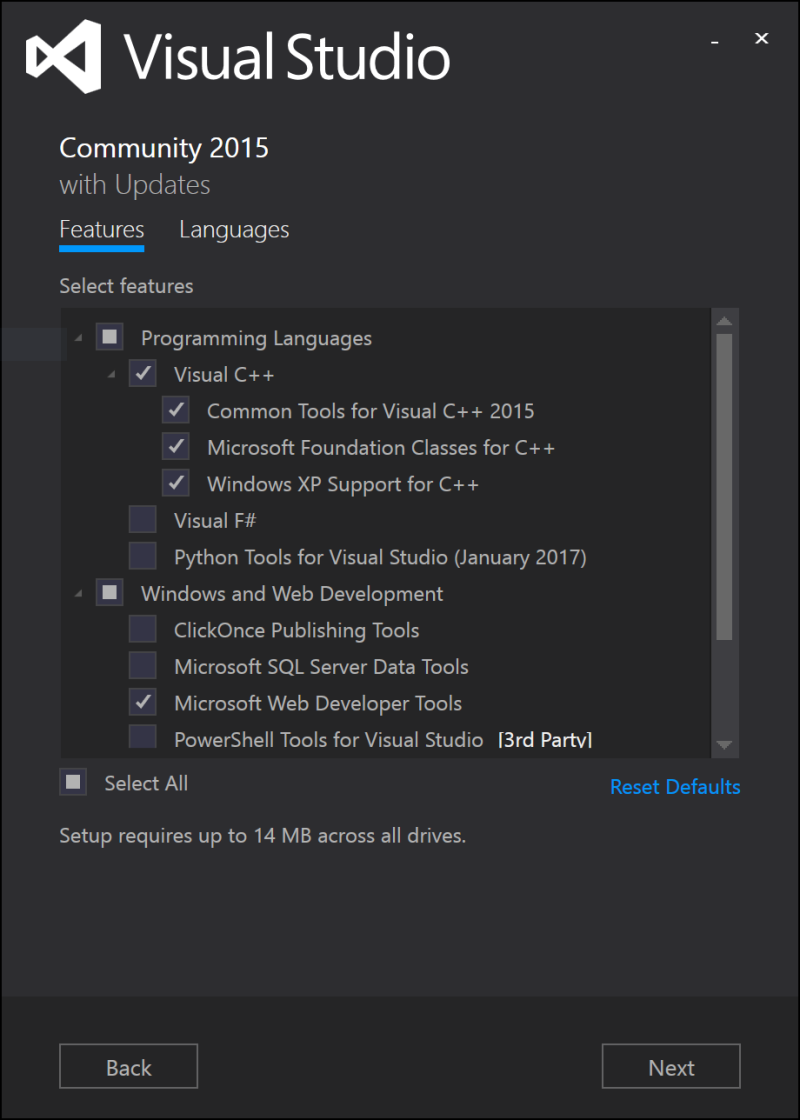
If you look carefully, you’ll see that the “cl.exe” program failed. The first error is ‘C:\Program’ is not recognized as an internal or external command. It took me a while to realize that the make program was not finding the cl.exe executable, and in fact this was not in the C:\Program Files (x86)\Microsoft Visual Studio 14.0\VC folder as it should have been. It turns out the cl.exe, which part of the C++ tools, is not installed by default in Visual Studio 2015. So, I had to run the setup again, and add these:
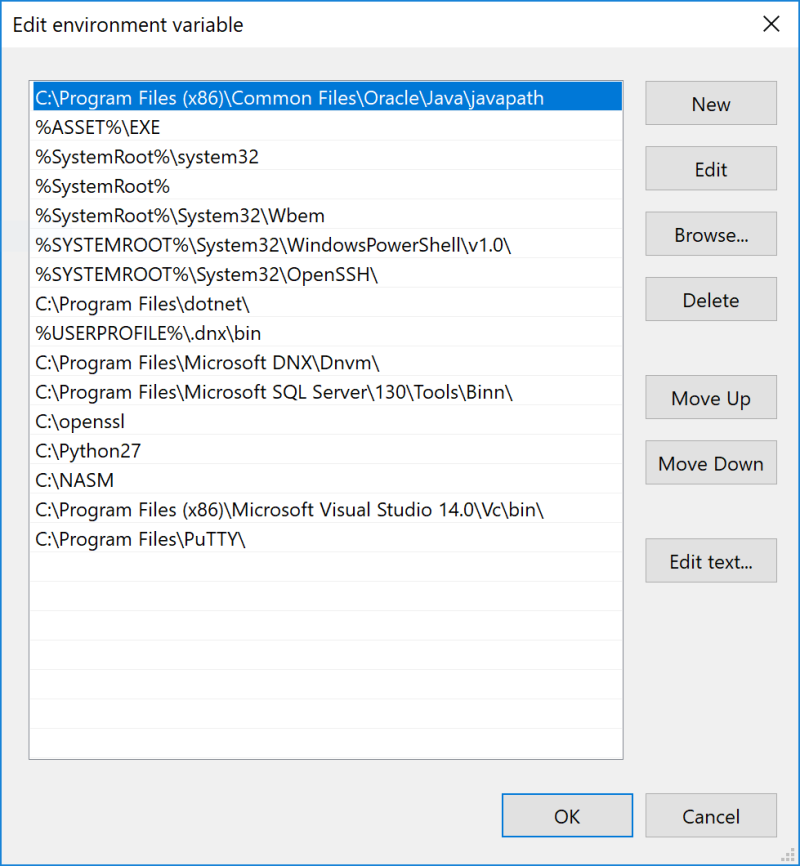
I also had to tinker with the system environment variables, so that all of the other utilities could be accessed via the command line. Here’s what my PATH looks like:
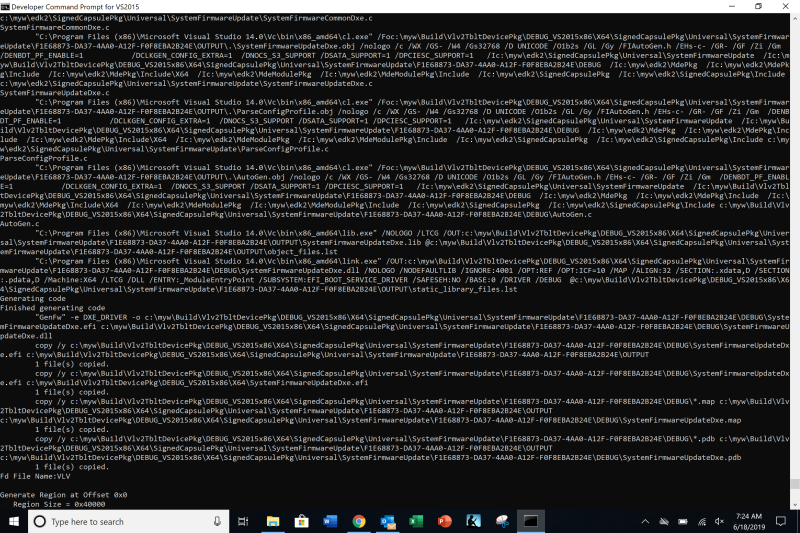
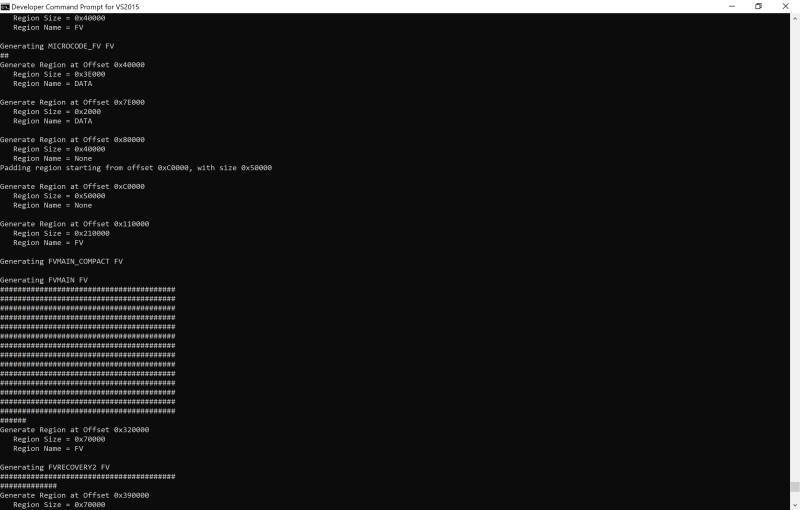
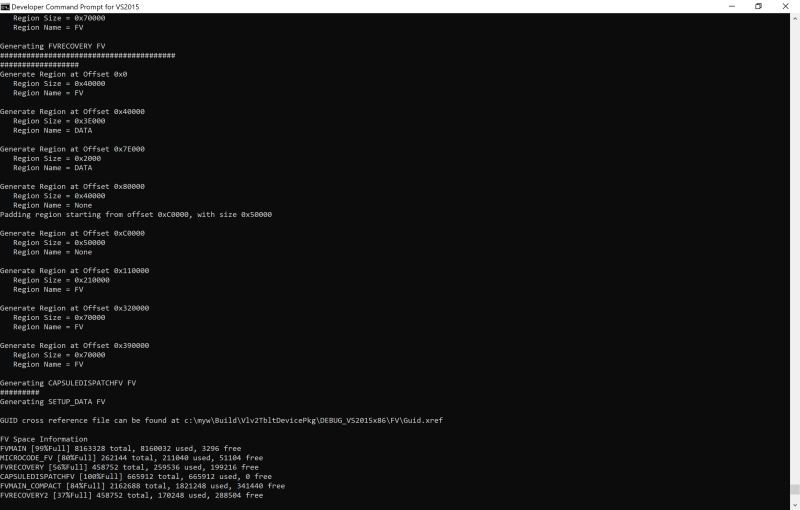
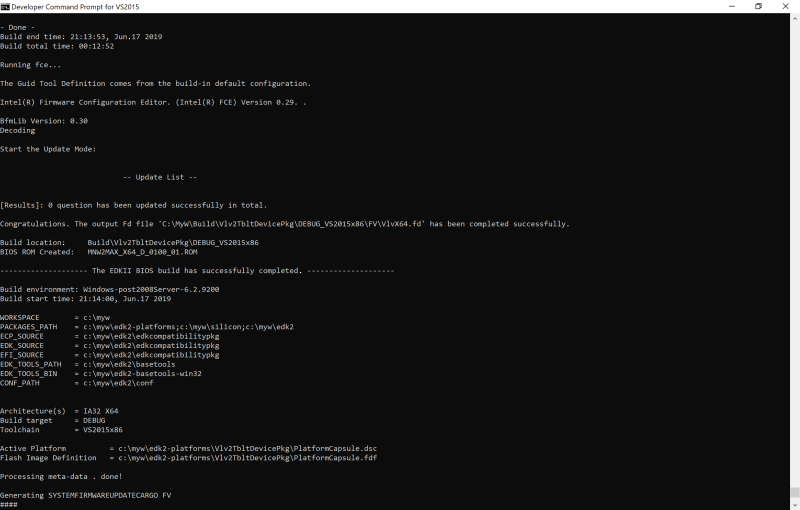
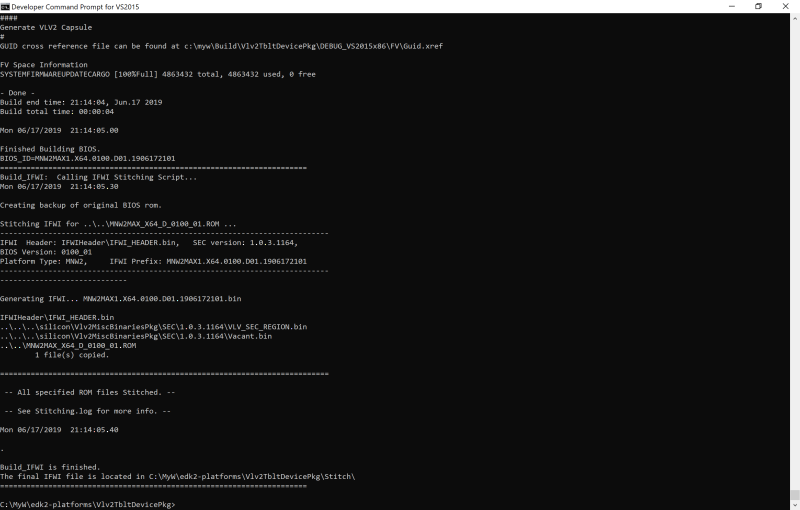
After all this, the build ran successfully. Here are the last five screens from the build output:
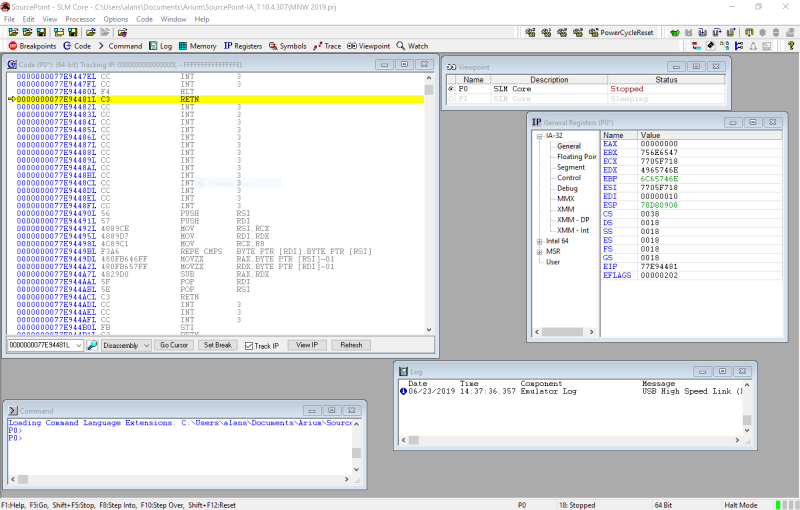
Note that I built a debug image, because I want to see source and symbols for later. After I loaded the image into the MinnowBoard and booted it into the EFI shell, I launched SourcePoint in the usual way, and got the expected startup screen:
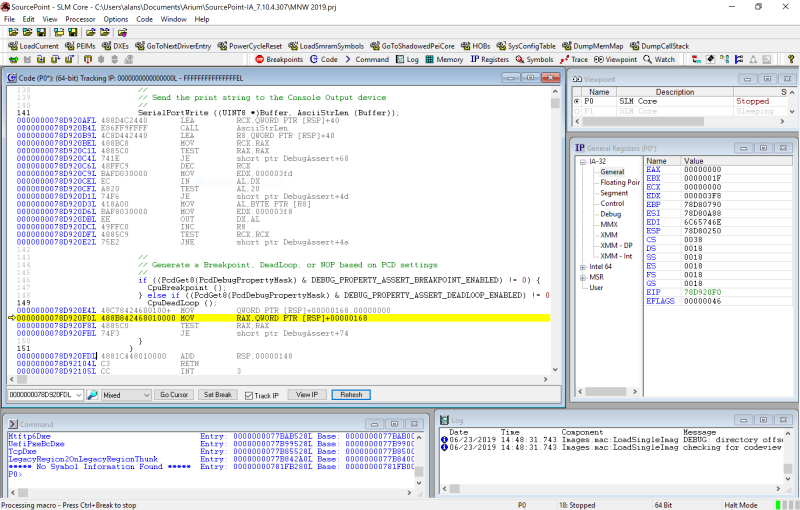
Note that the processor is halted, as is SourcePoint’s default behavior when a Project is launched. But, when I hit Go, and then Halt, I seemed to get into some sort of a deadloop. Loading the DXE source shows that this is indeed the case:
Note that we are within the CpuDeadLoop() routine, and no matter how many times I single-step, I stay within the three instructions starting at address 0000000078D920F0L. That’s because RAX is always 0, and the TEST RAX, RAX always causes the jump back.
This is indeed very interesting behavior. I am inside the DebugAssert () procedure. Where did that get called from? I mean, I was just sitting inside the EFI shell. Did something that SourcePoint did somehow trigger the DebugAssert()? I need to check this out! Maybe I’ll use LBR or Intel Instruction Trace to get more insight into what’s going on. That’s for next week.


