ASSET implements in-situ diagnostics via direct support of the x86 JTAG-based run-control API down on the target. The run-control API are synonymous with lower-level Intel In-Target Probe (ITP) procedures. What follows is a sample ‘C’ routine written to dump the contents of the machine check registers, in the event of a system wedge (for example, a three-strike event).
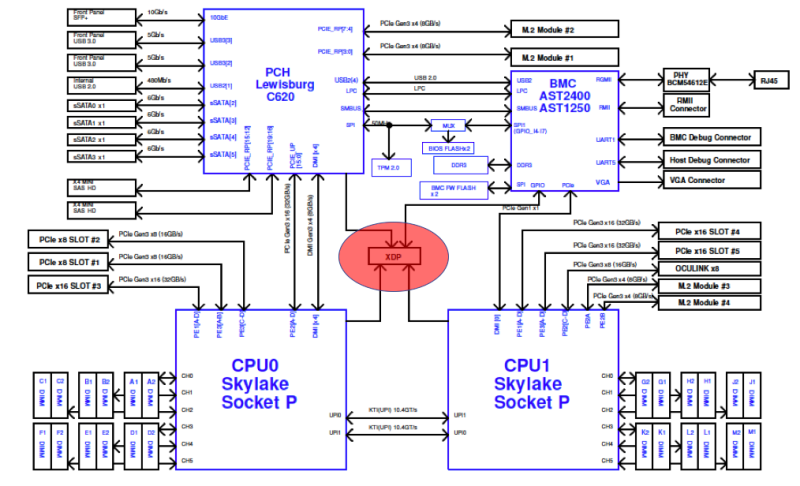
In the implementation of embedded ITP standardized within the OpenCompute server designs, connectivity is established between the BMC and the CPU JTAG chain:
This allows for hardware-assisted debug operations to be performed on the system, and has proved invaluable for root-causing intermittent issues that can only be captured at-scale. A close-up of the BMC/CPU topology is as below:
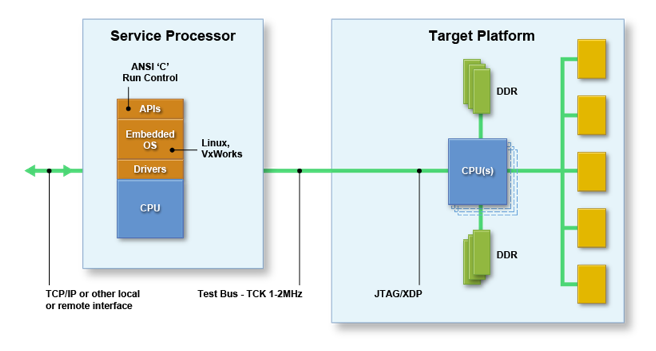
The service processor, or baseboard management controller (BMC) as it is termed on server platforms, can host a small ‘C’ library instantiating the ITP functions. A subset of the API presented is as follows:
EnterDebugMode
SetActiveCPU
SetActiveCore
SetActiveThread
ReadGPR
ReadMSR
ReadIO
ReadCSR
ReadMemory
DownloadUserDiag
ExecuteUserDiag
UploadDiags
ExecuteVCUcmd
The power of this solution revolves around three differentiators:
1. Security: ASSET’s solution runs down on the target, with no remote host required. This eliminates the need for perhaps untrusted external network access to run the debug functions.
2. Scalability: Applications can be run independently and simultaneously across multiple targets, without the need for a remote host. This is truly at-scale debug.
3. Performance: Since there is no handshaking to/from a remote host, the Ethernet bottleneck is eliminated; resulting in a tremendous performance boost.
In terms of #2 above, applications that write directly to the API and run down on the BMC are termed On-Target Diagnostics, or OTD for short. Since ITP presents a rich set of capability for hardware validation, debug, and test functions, many routines can use this environment to create out-of-band utilities. ASSET provides a standard environment for the creation of OTD, with full documentation. Below is some some code snippets from a small routine that dumps the contents of the machine check error (MCE) banks. Chapter 15 of the x86 Architectures Software Developer’s Manual is dedicated to a full description of the Intel Machine Check Architecture, and the essence of the OTD is to simply extract and display the value of the specified MCE bank. The standard preamble to all OTD is as follows, edited here for compactness by removing error checking, etc.:
ai_mOpen(pdctarget, 1, &mHandle)
ai_mSetTargetCPUType(mHandle, AI_purley)
ai_mGetITPScanChainTopology(mHandle, &topo, true);
ai_mSetActiveCPU(mHandle, m_socket);
ai_mSetActiveCore(mHandle, m_core);
ai_mSetActiveThread(mHandle, THREAD_ZERO_POS);
dumpmca(mHandle); // This is the working routine.
ai_mExitDebugMode(mHandle);
ai_mClose(mHandle);
And here’s the working routine:
void dumpmca(int mHandle)
{
int iError = 0;
uint32_t dataCount = 10;
uint32_t data[10];
char procName[] = "VCUSEQ_DUMP_MCE_BANK";
uint32_t addr;
uint32_t len;
addr = ((m_core & 0xFF) << 8) | (m_bank & 0xFF);
iError = ai_mExecuteVCUCmd(mHandle, procName, 1, &addr, dataCount, data);
if (iError != AI_SUCCESS)
{
printf ("VCU dump MCA ERROR: %s\n" , ai_ErrorToString(iError));
return;
}
printf("Dump of MCA registers for socket %d core %d bank %d\n", m_socket, m_core, m_bank);
printf("Control 0x%08x %08x\n", data[1], data[0]);
printf("Status 0x%08x %08x\n", data[3], data[2]);
printf("Address 0x%08x %08x\n", data[5], data[4]);
printf("Misc 0x%08x %08x\n", data[7], data[6]);
printf("Control2 0x%08x %08x\n", data[9], data[8]);
}
Armed with the man pages and documentation, it’s pretty straightforward to understand what’s going on. The preamble initializes the SED library, puts the target into probe mode, establishes communication with the target socket/core/thread, and dumps the specified MCA bank. It then cleans up and closes. And the dumpMCA main routine just pulls out the register contents and sends the results to the system console. Simple, huh?
Want to know more? Register for our eBook, ScanWorks Embedded Diagnostics Technical Overview.


