In collaboration with the UEFI Forum, I’ll be presenting Beyond Printf: Real-Time UEFI Debugging on Wednesday, October 27th 2021 at 10am CT. Register here: https://www.brighttalk.com/webcast/18206/512103 to watch the session live, and/or later view the recorded video. What powerful new debugging and trace features exist on the latest Intel silicon? Continue reading, or watch the webinar.
In my previous blog, Using the Intel Trace Hub for at-speed printf, I’ve hinted at some of the webinar content. In short, there are some amazing features in Intel silicon for debugging, that few people have used or even are aware of. I’m not 100% sure why these features don’t have as much visibility as you might expect; but I do know that most of us don’t use advanced Trace features for debugging on a day-to-day basis. If you’re a Visual Studio or VSCode Windows application programmer, you probably use print statements, breakpoints and watch windows. If you’re a UEFI, coreboot or other firmware developer, you probably use printf and deadloops/ breakpoints/ single-stepping.
But the new Trace features are beyond belief. For about 30 years, Intel had primitive trace capabilities, such as LBR – Last Branch Record, an MSR-based trace that can capture about 200-300 instructions. But in the last few years, they added Trace Hub, SW/FW Trace, ME Trace, Architectural Event Trace, and Intel Processor Trace to their lineup. Incredible. All that was needed was for third parties, such as ASSET, to add support for these within their debuggers.
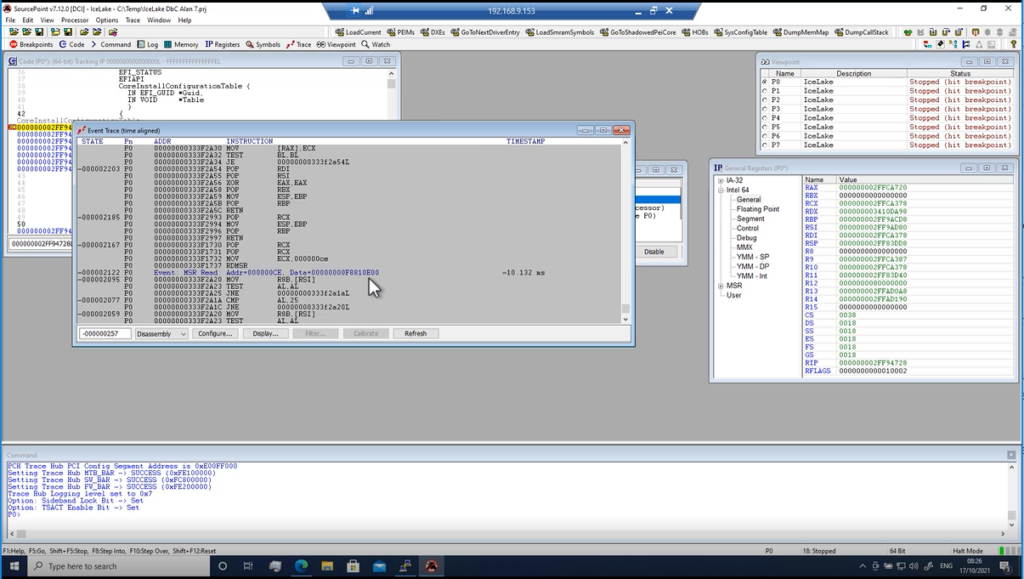
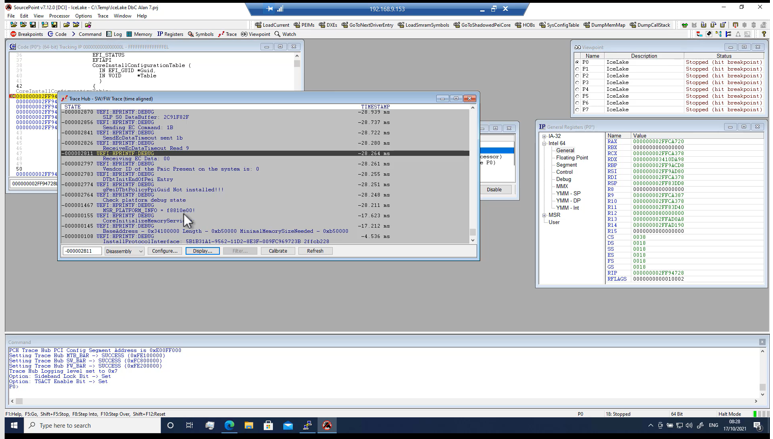
And that’s what we’ve done. You’ll have to watch the webinar to learn more, but take a look at a correlation between an at-speed printf output and an actual event trace capture of an MSR read:


Amazingly, the results of the MSR_PLATFORM_INFO read, x’F8810E00’, shows up both as an event and as the output of a customized printf statement that runs through the Trace Hub, without the overhead of the serial port and the printf code statement execution.
I probably can’t do much more justice to this here….watch the webinar for more. There’ll be a demo of this new technology at work. Your debugging will never be the same.


