
For debugging firmware, print statements (“printf”) are often our most powerful tool: some bugs are caused by complex sequences of events that are too long and intricate to root-cause using just breakpoints and watch windows. But, printf has some drawbacks: its processing code can run hundreds of instructions in the target code being debugged, and this execution time added to the backpressure caused by transports such as serial console output can cause the performance of the boot code to slow significantly, masking the “Heisenbug”. In this article, I write about my explorations into “at-speed printf”.
At-speed printf is a mechanism that uses the Intel Trace Hub logic to capture the output of, for example, UEFI “DEBUG” statements, without incurring the overhead of the printf code execution itself and the backpressure from the UART (serial port) output.
What is the Trace Hub? A simple view is below:
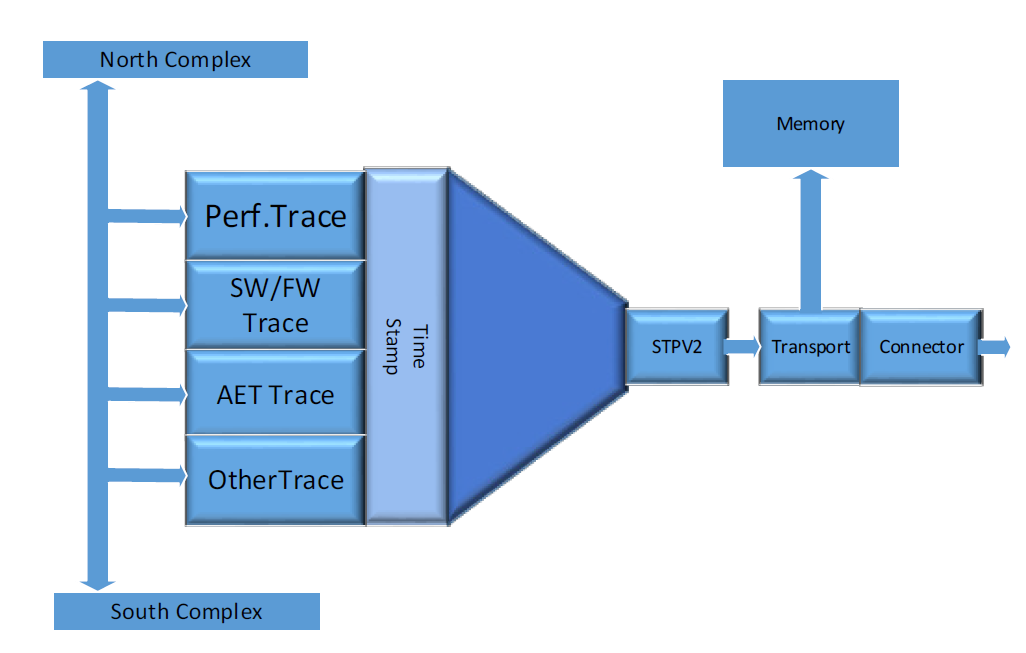
The Trace Hub is a piece of logic (IP) within the latest silicon (starting with Skylake) that sits on the MMIO fabric of an Intel platform. In the most basic use, programs running on any core can write debug messages and direct them to the Trace Hub instead of to a serial port, console or memory log. This means they are timestamped, and can be sent to system memory, the Master Storage Controller Trace Buffer (MTB), or out a USB port using the Direct Connect Interface (DCI, also known as DbC – Debug Class). Starting with Coffee Lake and beyond, enhancements were made to DbC that it no longer requires a hardware pod to connect a debug host to the Intel target – AND the trace data can stream into a buffer on the debugger host, directly out of system reset, allowing for tons of data to be stored, retrieved and analyzed.
As you’ll see soon, the trace data being sent to the Trace Hub can be timestamp correlated with Intel Processor Trace – putting all platform event data into a meaningful code context. This means that locating an event in a Trace Hub sequence (be it from a UEFI printf statement, an Architectural Event Trace (AET) event, a Management Engine (ME) message, etc.) will directly point to a spot in the instruction trace. This provides unparalleled insight into what exactly is going on in a target for bug triage.
Note that the Trace Hub must be enabled in the BIOS before use, usually in the PCH section of the BIOS settings menu. It then must be discovered by SourcePoint – and can be done very early in the boot flow – and SourcePoint will remember its location in the MMIO fabric, persistent across resets. Keep in mind that this should be done prior to the OS booting, as the OS will often “hide” the Trace Hub.
The Trace Hub is designed to support multiple streams of trace data. In fact, it supports up to 65,536 masters, each with up to 256 channels, for a theoretical maximum of 16M streams of trace.
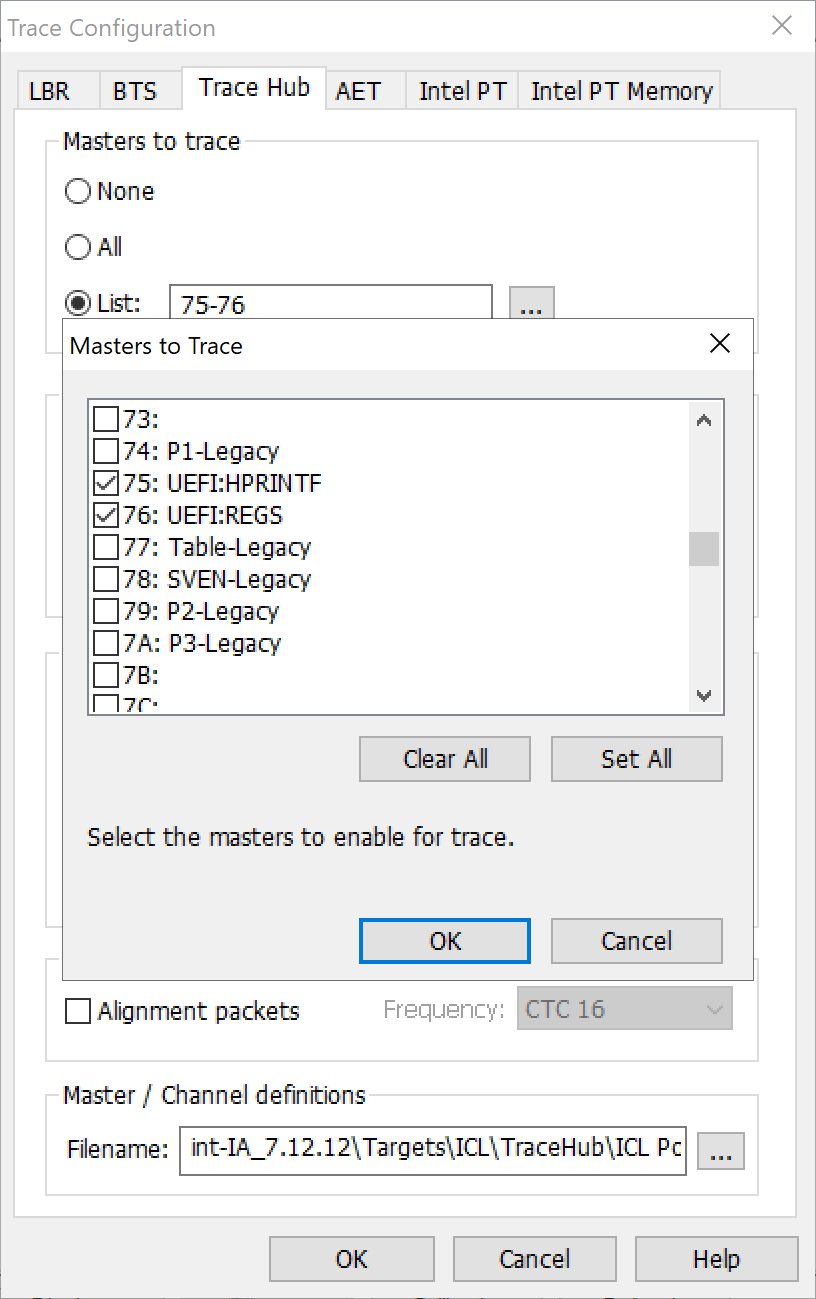
In SourcePoint’s Trace Configuration window, under the Trace Hub tab, you can see the settings that are used in the following screen shots:
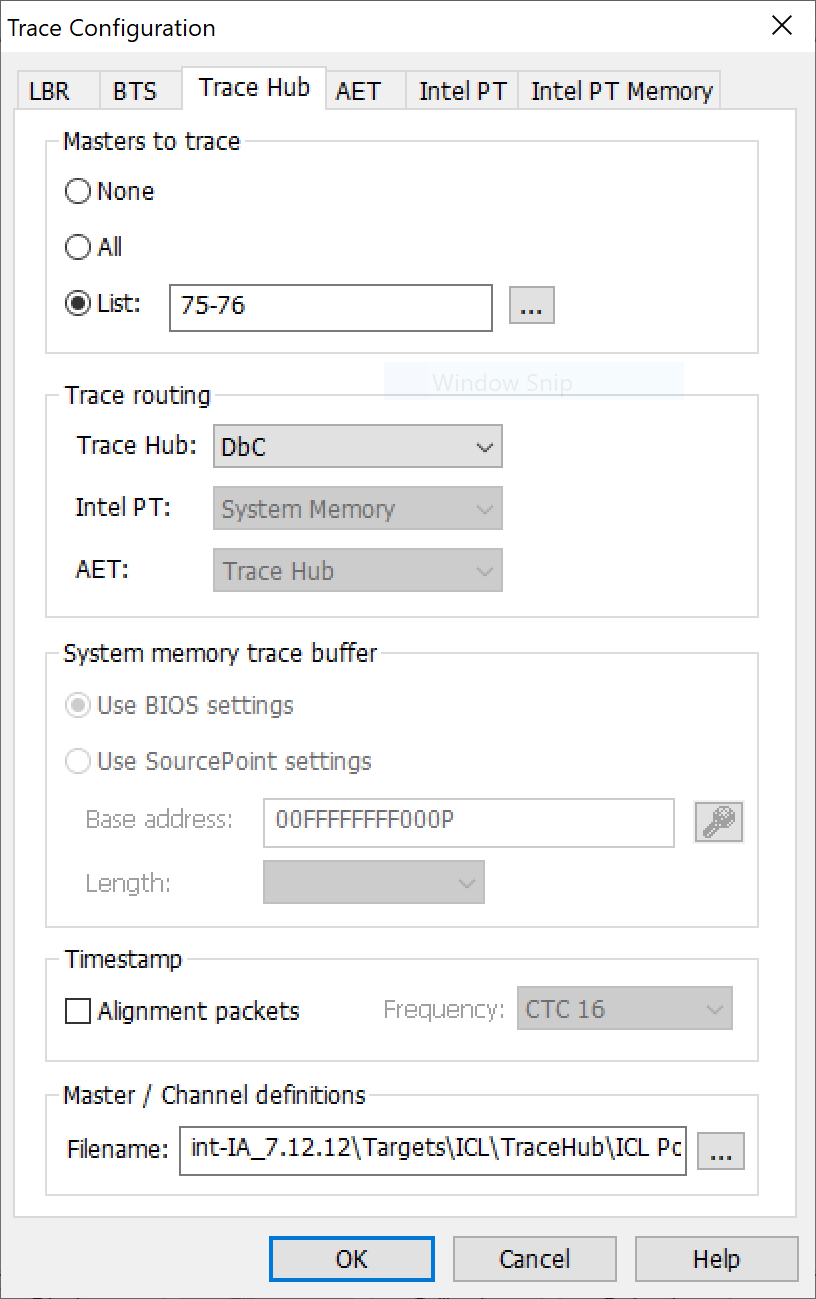
There’s a list of pre-filled Masters to trace (as below), capturing the events associated with each printf statement (designated as HPRINT – hosted printf) as well as the General Purpose Registers (UEFI:REGS) associated at the time of each printf:
To capture the printf statements, route them through the Trace Hub, and eliminate the need for the printf code execution, it is necessary to make some changes to the firmware build tree. I’ll outline some of the changes for the EDKII build tree for UEFI. But first, some background.
Three debug hooks within the EDKII framework are available for routing through the Trace Hub: DEBUG, ASSERT_EFI_ERROR and RCPRINTF.
DEBUG is used primarily to provide boot status information. Some examples in the code may be:
- DEBUG((EFI_D_ERROR, “Microcode not found.\n”));
- DEBUG((DEBUG_INFO, “GdtDscriptor Base Address:0x%X\n”,(UINT32GdtDscriptorBase));
- DEBUG((EFI_D_INFO, “bios Prog: lanePwrMask %05x\n”,lanemask));
Although the EDKII framework has defined the DEBUG hook as a macro, it actually performs a function call to “DebugPrint”, that in turn calls SerialPortWrite(). Currently, this uses the serial port and presents a significant increase in the execution time of the boot process.
I’ll cover the other two debug hooks, ASSERT_EFI_ERROR (usually used to cause a processor breakpoint, or enter a deadloop) and RCPRINTF (used at the very early stages of the boot process) in more detail later. There are also other macros available, such as those to display the general purpose registers and RIP with each printf, that I’ll write about later as well.
What do the changes to the build look like? I’ll summarize the main steps, with a promise that a more detailed treatise is on its way. Obtain the requisite system trace library files from ASSET, and follow these steps:
- Edit the MdePkg.dsc file to include the needed system trace library files:
MdePkg/Library/BaseDebugLibSystemTrace/BaseDebugLibSystemTrace.inf
MdePkg/Library/BaseDebugLibSystemTrace/BaseDebugLibSystemTraceSmm.inf - Edit the PlatformPkg.dsc file and replace the existing debug library. For example, for the UP Squared Apollo Lake board, edit:
\edk2\Vlv2TbltDevicePkg\PlatformPkgX64.dsc
and replace:
DebugLib|ModePkg/Library/BaseDebugLibSerialPort/BaseDebugLibSerialPort.inf
with:
DebugLib|MdePkg/Library/BseDebugLibSystemTrace/BaseDebugLibSystemTrace.inf
OK, if you haven’t yet been scared off by now, it will be worth it. Boot the platform and collect all of the boot flow printf information at-speed:
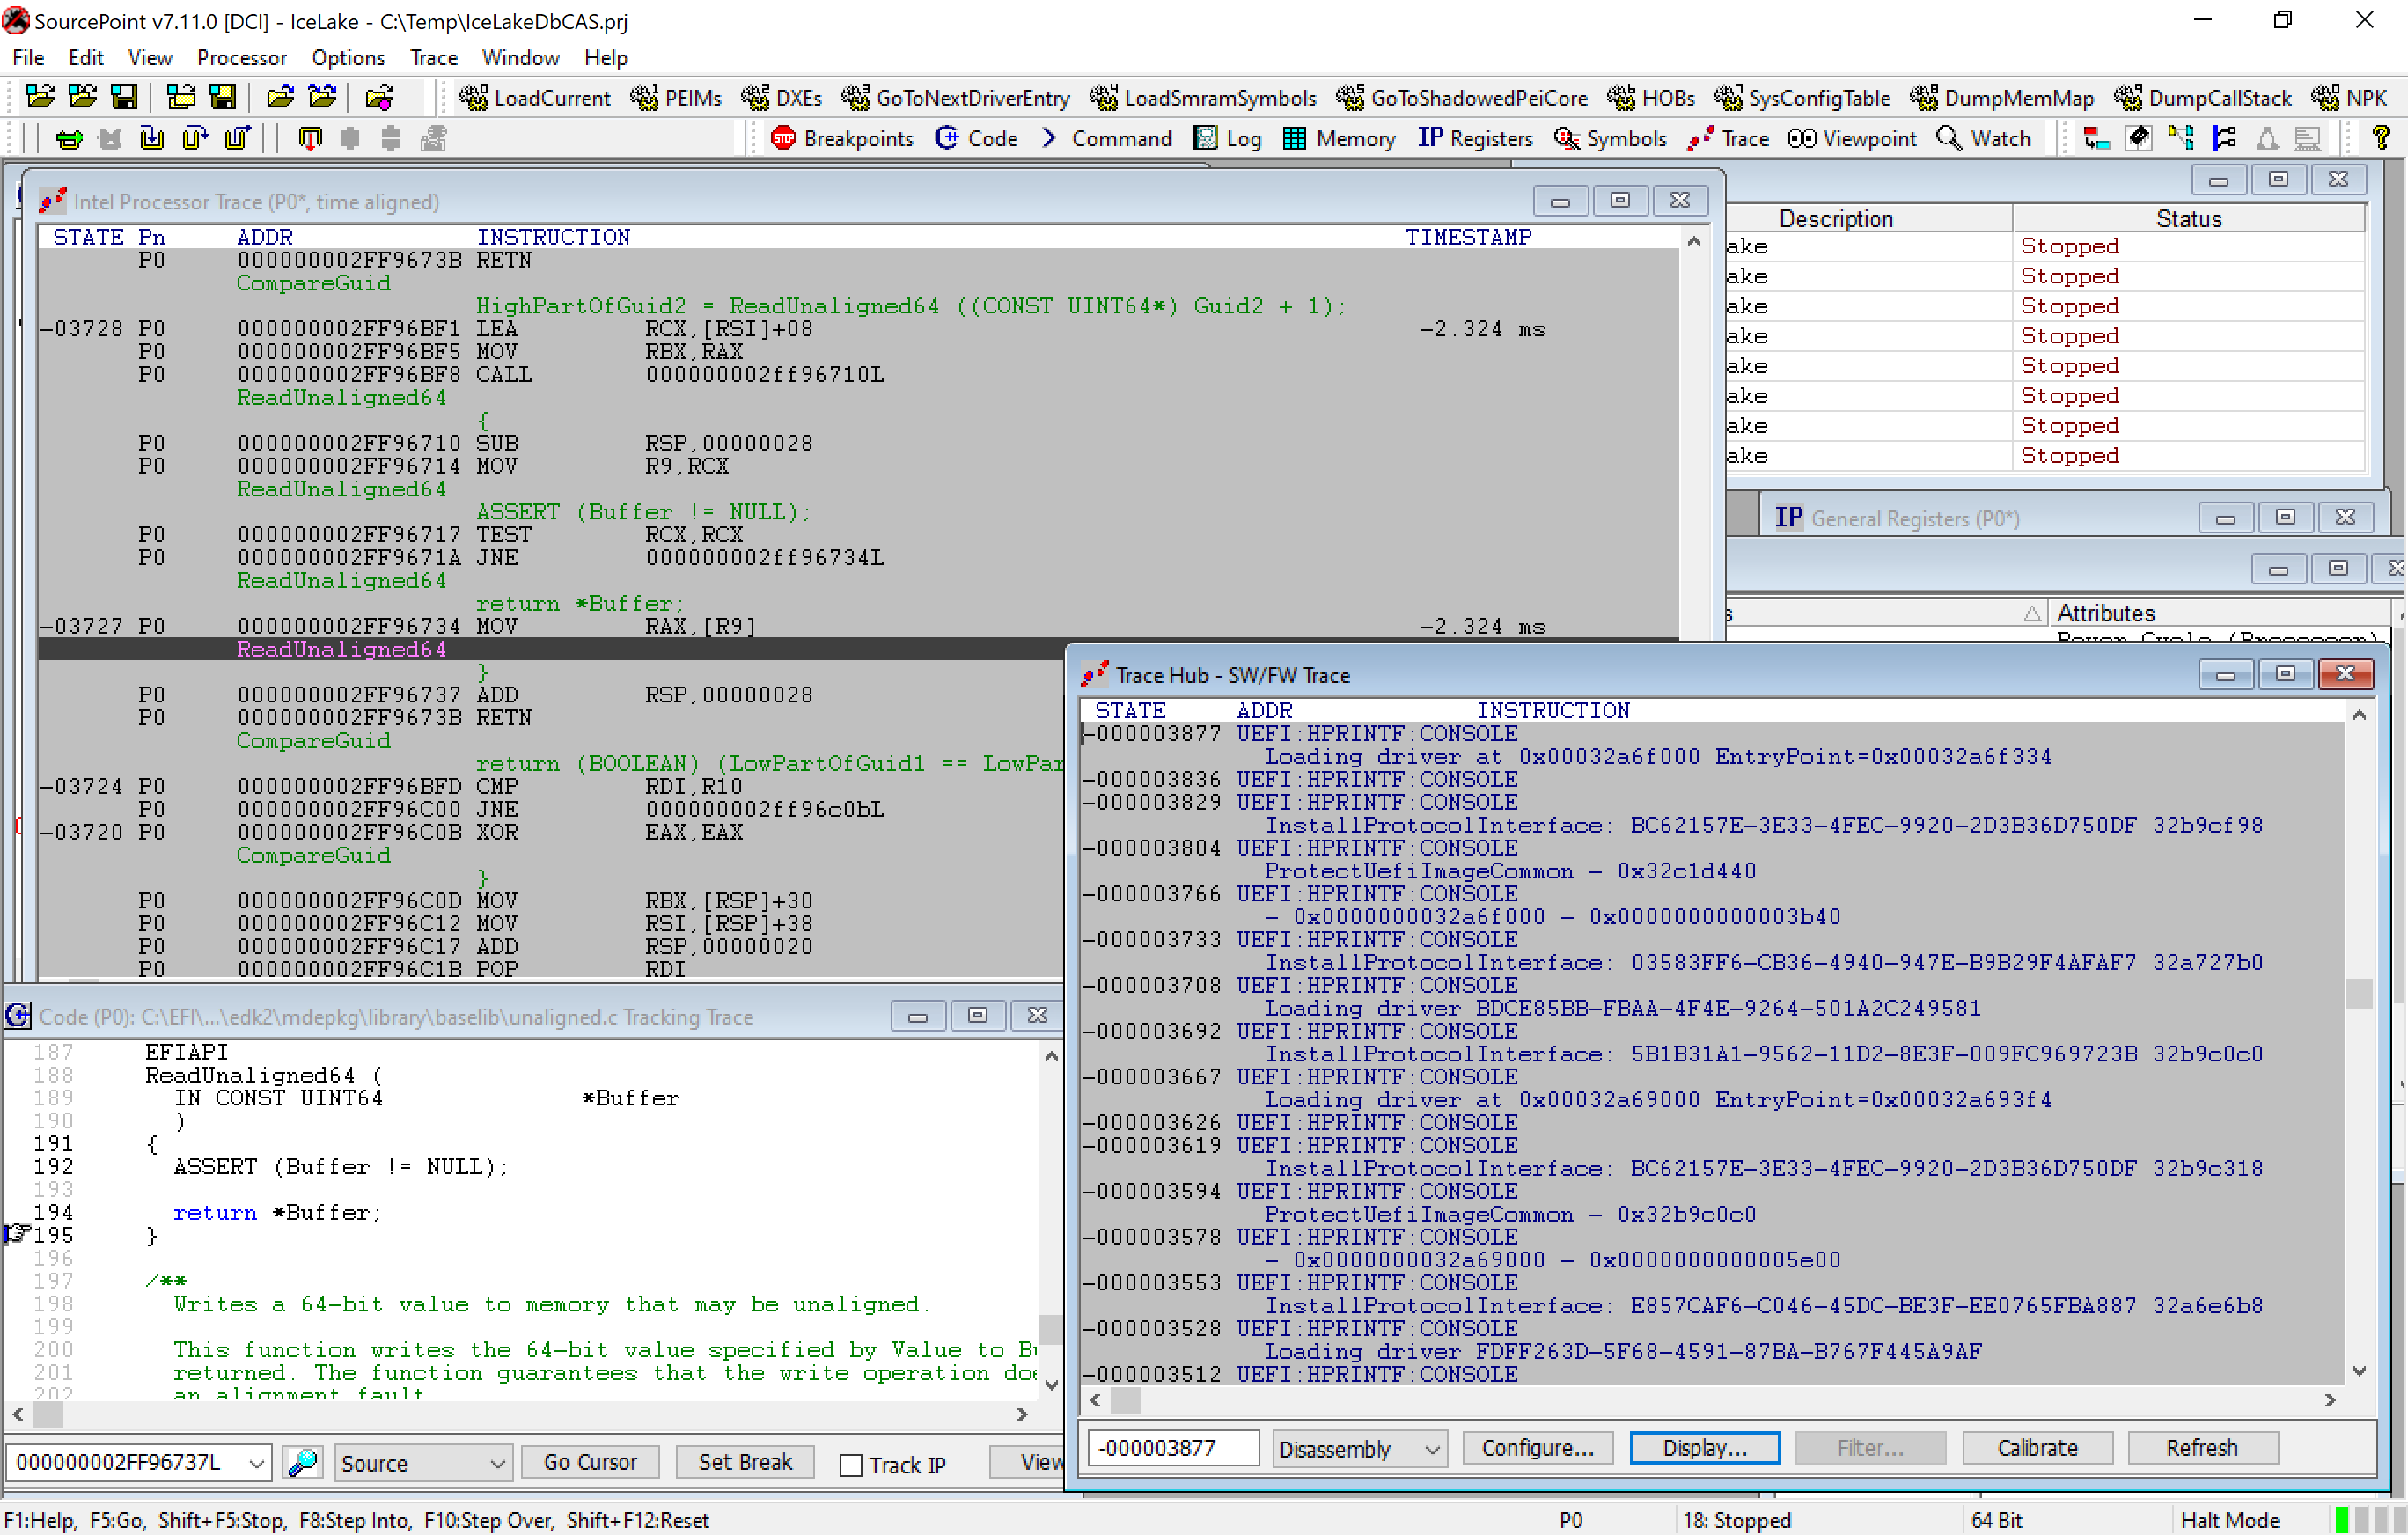
The Trace Hub at-speed printf data is at the bottom right. You can see its corresponding Intel Processor Trace at the top left. And a Tracking Trace window, based on where the highlighted line in the instruction trace window is, is in the bottom left. You can move around from window to window and highlight parts of the code and the corresponding windows will all update automatically.
I’ll be doing an in-depth webinar on this topic, with some live examples, next month in conjunction with the UEFI Forum. In the meantime, if you’d like to learn more, read our eBook on the Intel Trace Hub (note: requires registration).