
For each of the months of January, February and March, I did a webinar on JTAG-based debugging. Since each of the video recordings are about 45 minutes long, I thought it would be helpful to point out the highlights of each, if you don’t have time to sit through the full durations. At the risk of sounding immodest, there are some real gems of information within the demos of each webinar.
January: JTAG-based debugging of AMD EPYC servers
In this webinar, held Wednesday, January 27th, 2021, I plugged SourcePoint into an AMD Rome platform, and demonstrated run-control.
You can watch the recording on our website here: Webinar recording: JTAG-based debugging of AMD EPYC servers. In it, you can see how powerful a hardware-assisted debugger can be, especially when it comes to “bare-metal” firmware debug.
The demo starts at about 10 minutes into the video. I connected to an AMD Rome customer reference board known as “Ethanol-X”.
At 15 minutes in, I reset the target and halted at the AMD version of the reset vector. It’s common knowledge that the AMD Platform Security Processor (PSP) – somewhat equivalent to the Intel Management Engine – does a lot of the heavy lifting before the x86 portion fetches its first instruction.
At 21 minutes in, we take a look at the different types of breakpoints available on AMD systems. Note that hardware breakpoints cause the processor to stop immediately, with little or no “slide” for non-execution breaks (i.e. breaks occurring on Data Access, Data Write, and I/O breakpoint types). Pre-fetched but unexecuted instructions do not cause the processor to stop. Each processor has a maximum of four hardware breakpoints available. And, of course, the code location of an execution breakpoint can be in ROM.
At 28 minutes in, we see SourcePoint’s lightning-fast symbol search, which is essential for source-level debugging. The entire symbol library of the image can be searched in fractions of a second. You can look inside the Code, the Data, and all of the Modules themselves, with tremendous pattern matching abilities: “Starts with String”, “Contains String”, “Wildcard Pattern”, and even using a “Regular Expression”.
At 33 ½ minutes in, there’s a demonstration of the power of the SourcePoint Command Language. And using that, go to 37 minutes to see the use of the command language within a built-in macro that dumps the UEFI Hand-Off Blocks (HOBs) that are found in system memory.
Overall, the video does a good job of displaying SourcePoint’s built-in x86 debugging capabilities. The Intel version of the tool is very much the same, with the exception of additionally supporting the Intel Trace features such as Processor Trace and Architectural Event Trace (AET).
February: UEFI Debug with Intel Architectural Event Trace
And speaking of AET, that’s the subject of my February webinar.
This webinar was done on February 25th, 2021, in collaboration with the UEFI Forum. You can view it on YouTube: https://www.youtube.com/watch?v=pHSvcO0ogdc or on BrightTalk: https://www.brighttalk.com/webcast/18206/464735. Note that on BrightTalk, you’ll have to create a userid on the system, if you don’t already have one.
At 16 minutes in, you see that demo configuration: I was connecting to an Ice Lake Client (notebook) platform, using the Intel Direct Connect Interface (DCI). This allowed for the demonstration of streaming trace, a very powerful aspect of AET.
You know, you have to give Intel credit: after 30 years of the same old silicon-based debug run-control capabilities with some rudimentary trace, they went pedal to the metal over the last few years and introduced a bunch of new Trace features. They have both instruction trace and event trace covered now: with Intel Processor Trace, and Architectural Event Trace. Actually AET is supported by, and is only one facet of, the event-tracing capabilities introduced by the Intel Trace Hub. I’ve written about the Trace Hub and AET a lot in the past, but this webinar really captures the essence of these capabilities. You’ll have to watch the full video to get the full appreciation; at the risk of sounding immodest, it’s pretty good.
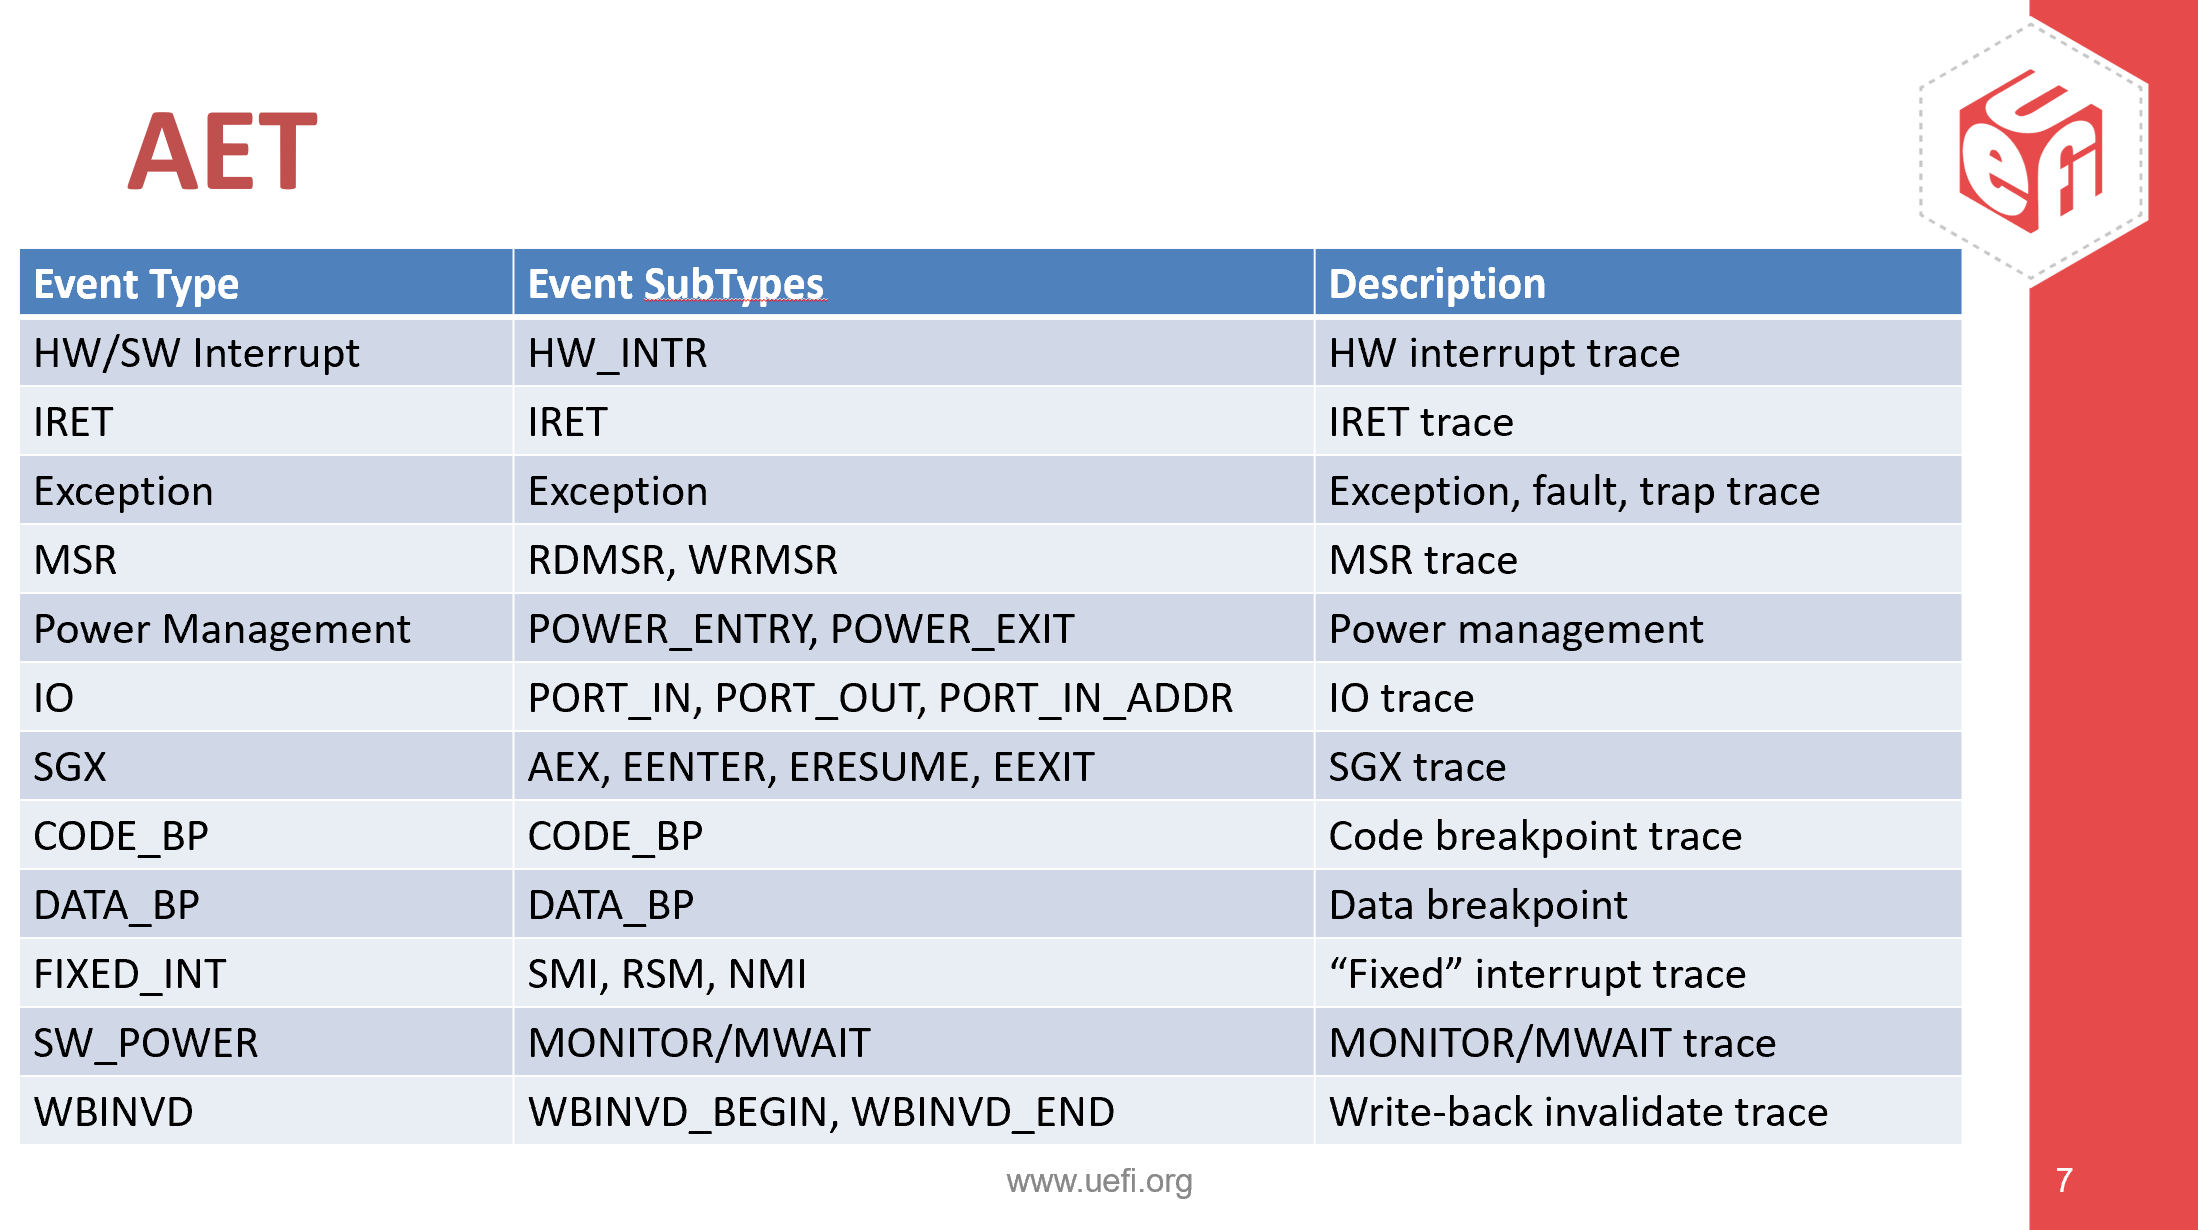
Look at the table above to see the events that can be captured by AET. It should be fairly self-explanatory.
At 20 minutes in, we set up the Trace Hub.
At 21 minutes, we set up AET to trace each and every MSR read and write on the platform, and then reset it, capturing every one of these events streaming out the DCI USB connection to SourcePoint. Wow.
At 25 ½ minutes in, we see a Code Breakpoint being traced as an event. What that means is that, instead of halting the platform when the instruction pointer hit that particular address, it just collects the information as an event, AND collects the Last Branch Record (LBR) instruction trace as well. Think about that for a moment. This happens at a microarchitectural level, doing a “hook” on the regular behavior of a hardware breakpoint. There’s no better way to troubleshoot the most intermittent, difficult-to-debug problems; think about its use in debugging concurrency issues, race conditions, and the most challenging “Heisenbugs”.
At 30 ½ minutes in, we see the same approach used for Data Breakpoints as well. After that, there’s a great simulation of tracking the root cause of an “evil maid” attack, showing the value of AET for cybersecurity research. This is by far my most favorite part of the webinar; hopefully it’s as fun to watch for you as it was for me to make.
March: Embedded @Scale JTAG-based debug of x86 servers
Finally, on March 24th, 2021, I did a demonstration of ScanWorks Embedded Diagnostics (SED): Embedded @Scale JTAG-based debug of x86 servers.
It’s worthwhile looking at the slide at nine minutes into the presentation, to see the overall topology of SED. The concept here is to take the run-control functionality that is normally part of a benchtop solution, and embed it in a BMC to provide at-scale debug capabilities. If you’ve watched a least a portion of the first two webinars listed above, you’ll get it. Once the BMC is equipped with at-scale debug capabilities, it acts as an autonomous embedded debug agent on any of an infinite number of servers, unconstrained by the limitations of time, geography, and physical access with a legacy hardware probe or USB cable.
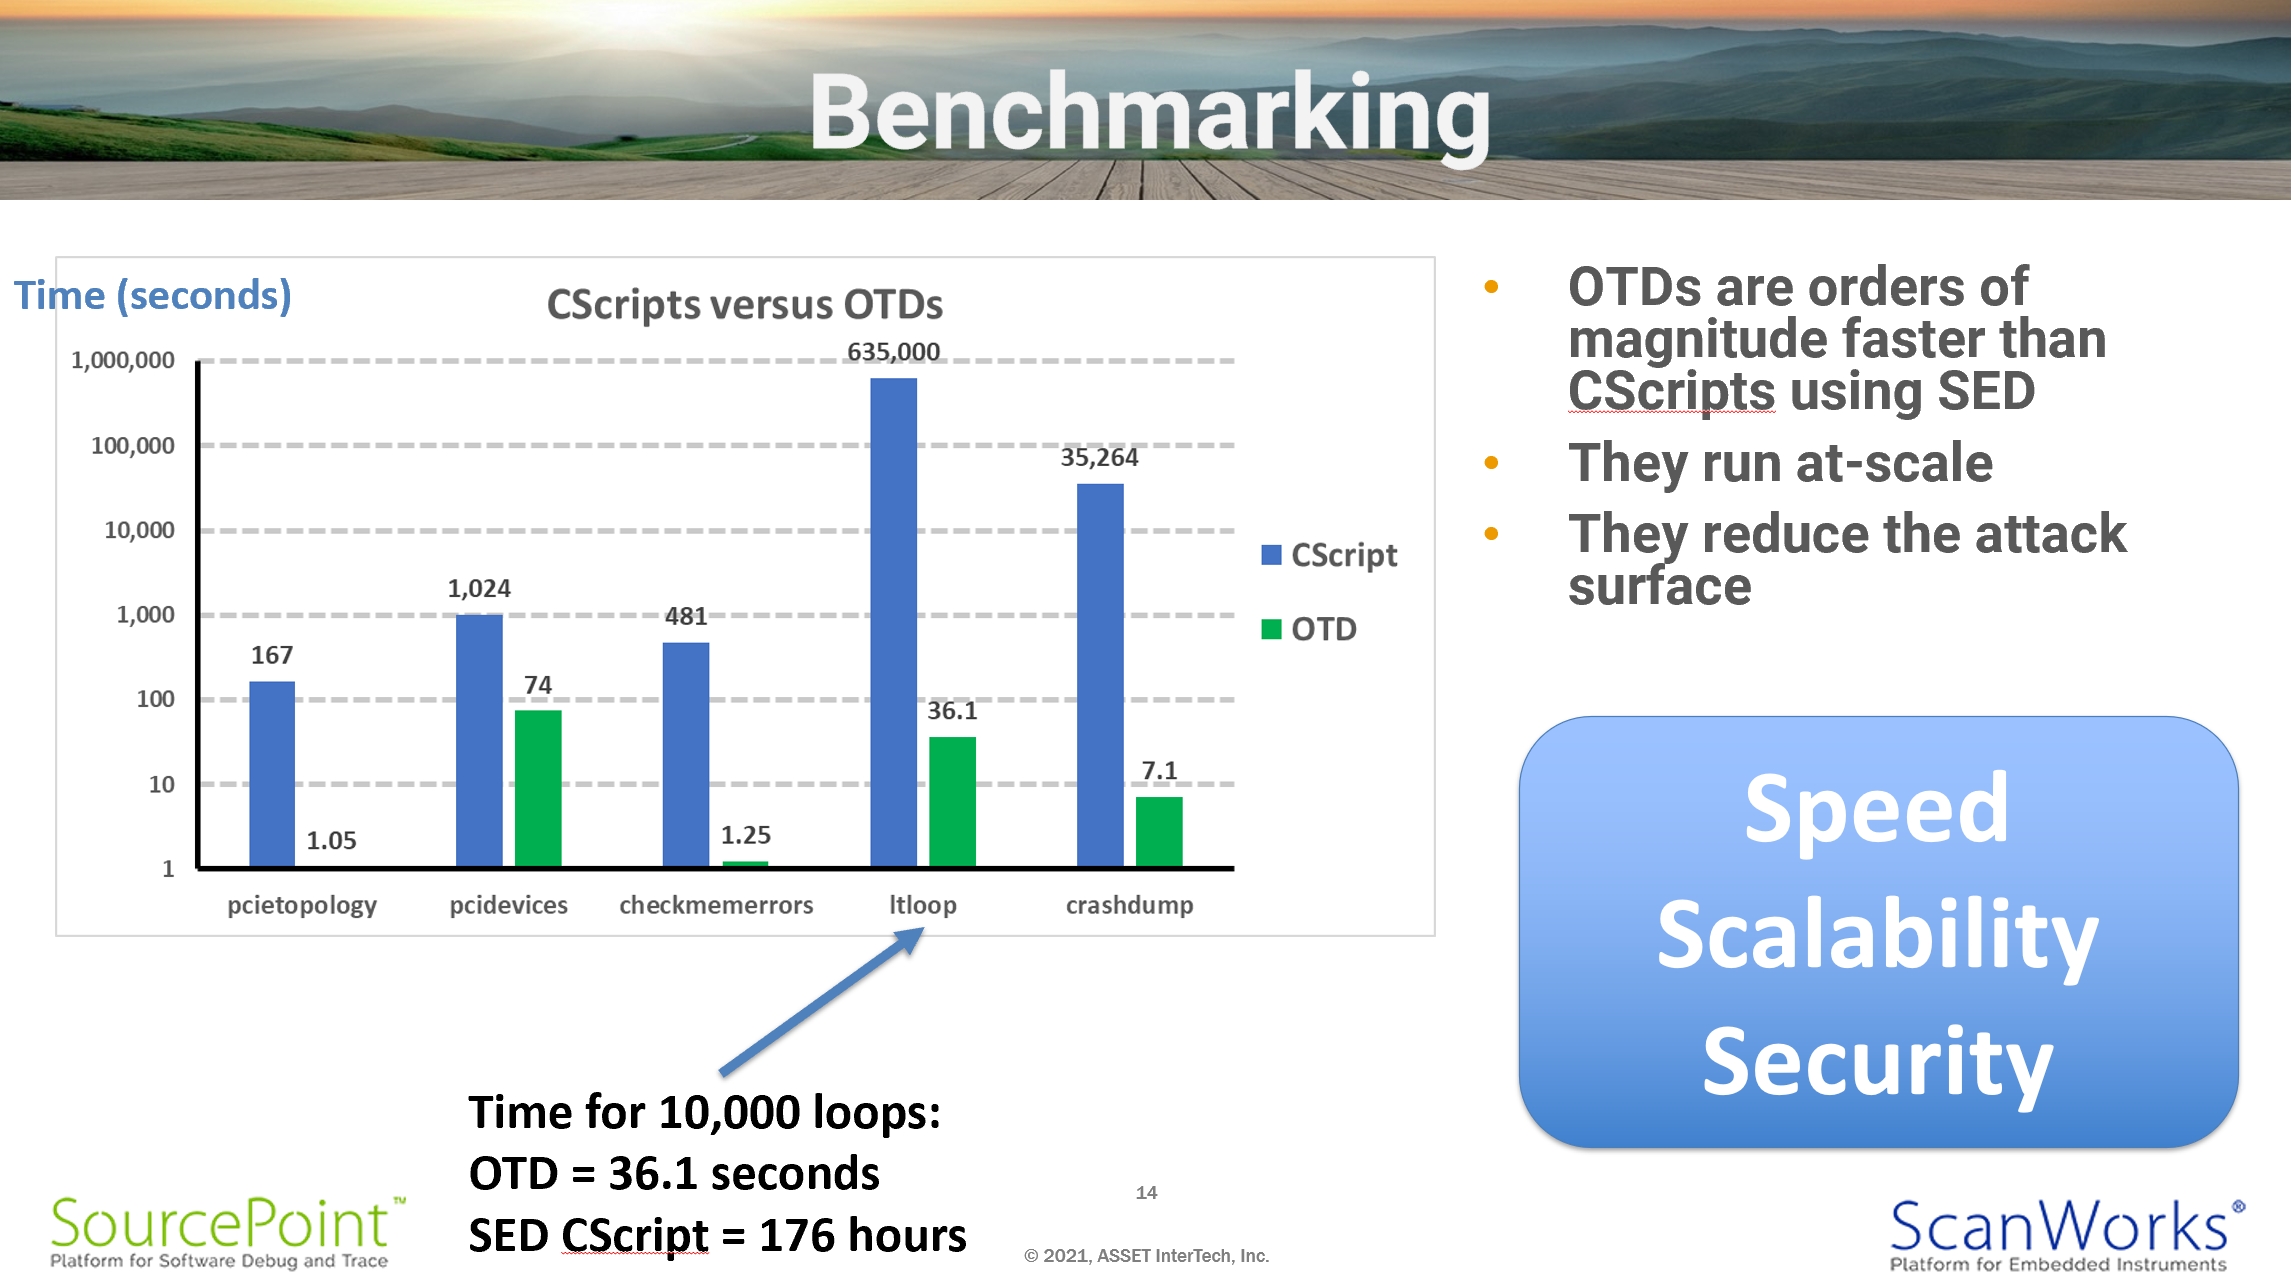
The most innovative aspect of ASSET’s SED is the embedding of the run-control functionality down on the BMC, as opposed to on a remote host. That’s a paradigm shift from previous solutions, and results in greatly enhanced scalability, security and speed. The table above shows a timing comparison between running Python-based CScripts remotely, versus porting them to ‘C’ and running them autonomously down on the target. Note that the scale is logarithmic based upon powers of ten, given the huge difference in performance between the two solutions. Look at the crashdump utility, for example; 35,264 seconds using the remote SED CScripts, versus 7.1 seconds using a BMC-based on-target diagnostic (OTD). Amazing. Think of what you can do with platforms forensics given that difference in scale and speed. And it’s more secure as well, since the BMC is autonomous and does not have the Ethernet connection back to the remote host as an attack surface.
At 24 minutes into the webinar, the demo begins. Firstly, I covered off using the pcie.topology, pci.devices, klaxon.checkmemerrors, pcie.lt_loop and crashdump Python CScripts running on the remote Windows host. Then, at 41:17, the equivalent OTDs are shown running on the ASPEED BMC, so the performance improvement can be seen. Pretty impressive.
Well, that’s it for the three webinars. I might not make another one for a while, since they’re quite time-consuming. If you want to know more about any of the topics above, the best way to reach me is via our Contact Us page; just fill in the form, and I’ll get it.