
This past week, I did a webinar in collaboration with the UEFI Forum on JTAG-based UEFI Debug and Trace. This reviewed some of the often-used tools for low-level triage of difficult-to-diagnose, intermittent bugs. Near the end, I demonstrated the usage of technology running directly down on a BMC to perform low-level functions not achievable with firmware or OS-based applications.

You can see the webinar on YouTube and on BrightTALK. The 44-minute, 29-second combination presentation and demonstration covered a lot of material: among the highlights were detailed technical coverage and demos on:
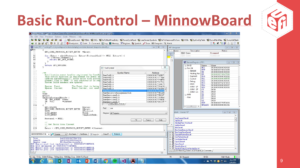
Run-Control (demo starting 16 minutes, 29 seconds):
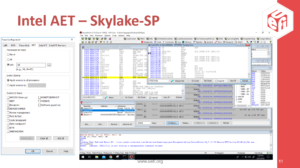
Architectural Event Trace (demo starting 19:25):
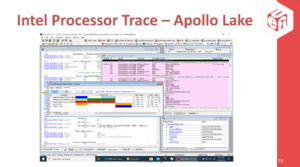
Intel Processor Trace (demo starting 22:48):
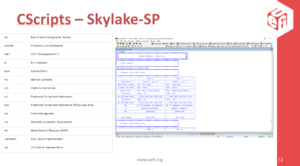
Intel Python CScripts running on remote host (demo starting 28:01):
Python CScripts ported to ‘C’ on BMC (demo starting 32:42):

If you’ve gotten this far, you’re probably familiar with the Intel CScripts, and how they are used for design validation, debug and test. The first CScripts demo starting at 28 minutes into the webinar used our ScanWorks Embedded Diagnostics (SED) firmware to run the lt_loop() CScript, which is a basic link retrain application designed to stress PCI Express ports and look for board or chip marginalities. Running one loop in this environment took about 49 seconds – rather slow, due to a lot of overhead associated with the PC-based Python interpreter, the middleware on the PC, the Ethernet connection between the host and target, the logging of transactions for debug purposes, and other factors. We could speed this up a little bit, of course, by removing logging and other optimizations. And running this with a benchtop debugger, such as SourcePoint, is another speedier option. But, there is a better way.
To overcome this latency issue, one approach is to take the Python-based CScript, re-write it in ‘C’, and port it to run down on a BMC, invoking the run-control API directly within our SED firmware. We call this an On-Target Diagnostic – or OTD for short. OTDs have the following advantages:
Speed – by running natively down on the target, and avoiding the host backhaul, performance becomes significantly better.
Security – by avoiding the Ethernet backhaul, and having the application run autonomously on the BMC, the network connection is eliminated as an attack surface.
Scalability – the SED firmware and OTDs can run at-scale, on hundreds or thousands of servers simultaneously and independently.
You can see the execution of this OTD starting at 32:42 in the webinar video, and in the screenshot above. It runs 1,000 PCIe link retrains in 2.87 seconds. That is blazingly fast, of course. Over four orders of magnitude faster than the remote CScripts example.
In a later article, I’ll include the source code for this OTD, and walk through a more detailed description of the functionality.
This is but one example. Another training code sample we provide in our SED firmware is dumpmca, that dumps the machine check architecture (MCA) registers for a given socket(s), thread(s) and bank(s). This is a subset of the functionality within an autonomous JTAG-based crashdump utility. A sample console output is below:
>./dumpmca -s1 -c1 -b0

dump MCA register bank
Library version = 0.22.04
Selecting socket 1

Global machine check registers:
MCG Cap register:         0x000000000f000c1c
MCG Status register:      0x0000000000000000
MCG Control register:     0x0000000000000001
MCG EXT Control register: 0x0000000000000000

Machine check registers for socket: 1  core: 1  bank: 0
IA32_MC0_CTL:    0x0000000000000fff
IA32_MC0_STATUS: 0x0000000000000000
IA32_MC0_ADDR:   0x0000000000000000
IA32_MC0_MISC:   0x0000000000000000
IA32_MC0_CTL2:   0x0000000000000000
Time for test:    0.17 seconds.

Done, exiting debug mode.
This is another good topic to write about in the future. I’ll include source code as well, and walk through the operation of the API.