Yes, Intel Skylake-EP, also known as Skylake-SP, or Purley, or Intel Xeon Scalable Processor, is past the “line of demarcation”; which means some more of its powerful capabilities can be revealed in the public domain. I managed to get my hands on a server platform with this CPU, and looked at some of the advanced debug and trace capabilities within the silicon.
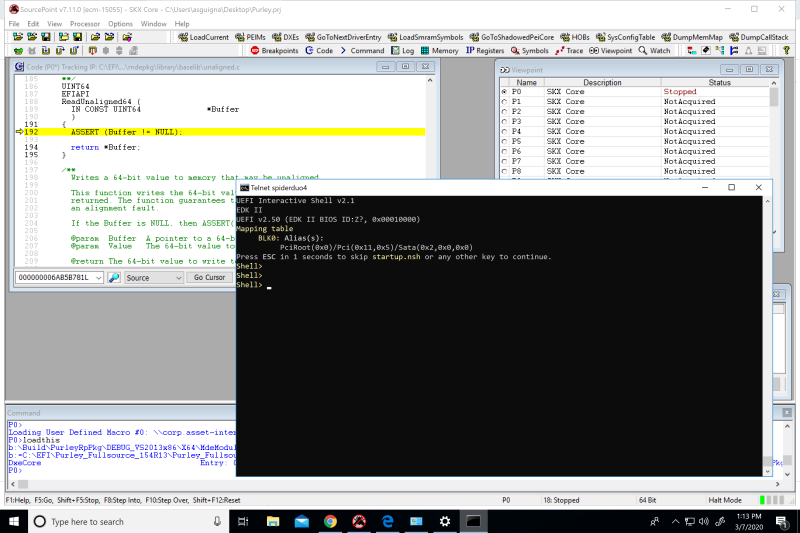
I booted the platform to the UEFI shell. You can see several things from the small number of windows open on the screen:
Yes, we are indeed sitting at the shell.
I invoked the “Halt” button to put the CPUs into probe mode. As you can see, only P0 (the first thread of the first socket) is actually running anything. The other threads are in a “Not Acquired” state to make run-control more efficient. If you scroll down further in the Viewpoint windows, you can see that there are 112 active threads; which makes sense, as each CPU has 28 cores, 56 threads, and it is a two-socket server.
In the command window, the current module is displayed as DxeCore. And in the Code window, we are in unaligned.c, within the ReadUnaligned64 function. This function is quite short; it just does an ASSERT(Buffer != NULL); and then does a return of *Buffer. And by single-stepping through the code, we see that when we return, we jump back into the a sequence of ReadUnaligned64 calls from within CompareGuid() within memlibguid.c:
Let’s look at the most basic of trace features within the Intel silicon: Last Branch Record (LBR). LBR trace displays a history of executed instructions. It does this by reading designated pairs of MSRs that contain the source address (from address) and destination address (to address) for all branch instructions (such as JMP, JCC, LOOP, CALL, etc.). The advantage of LBR trace is it is non-intrusive; the processor can run at full speed when using LBR trace with as close to zero overhead as you can get. The disadvantage of LBR trace is the limited number of MSR address pairs available (for Skylake-EP, there are 32 pairs). So, if you assume an average of 5 instructions between branches, then roughly the last 160 assembly language instructions executed are traced.
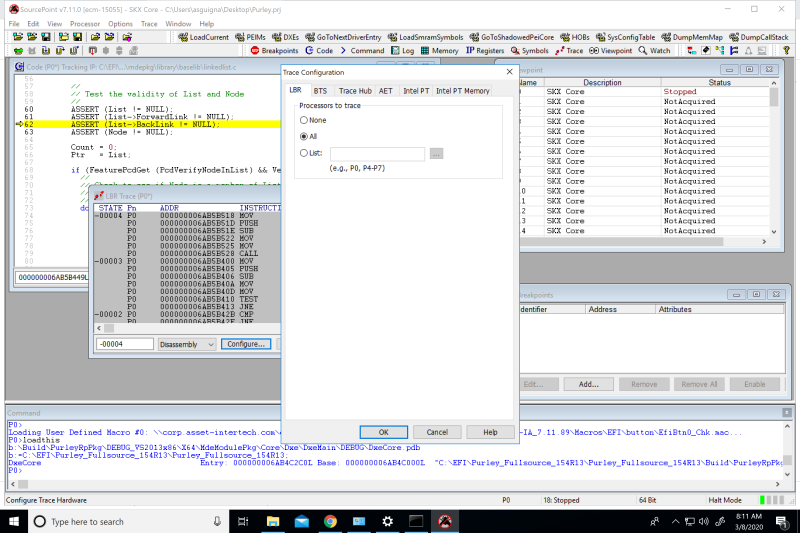
LBR is easy to set up in SourcePoint: click on the Trace macro button, and Configure LBR to trace some or all of the threads:
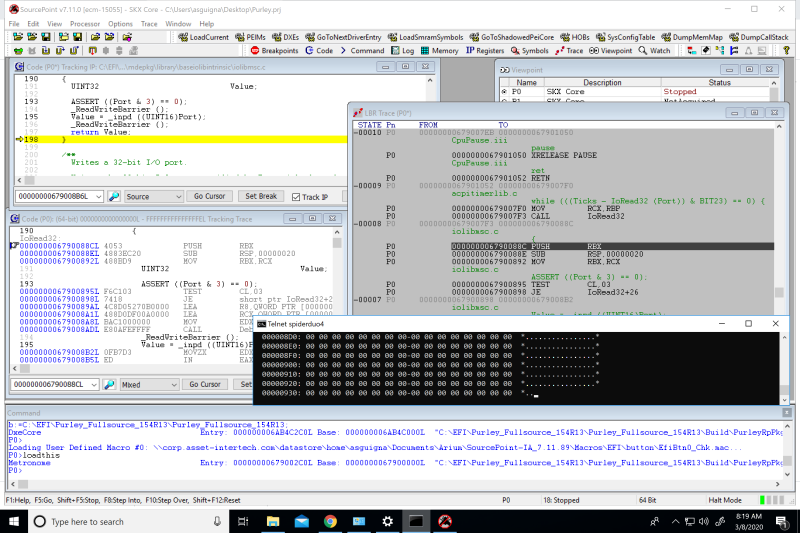
Then hit Go to get the platform running again, and just as an example go into the shell and type “pci 00 00 00 -i” to run through some code. Then halt again, and see the Trace capture:
I’ve also opened up a Tracking Trace window on the left that will display the code that I click on within the Trace window. Since all windows are time-aligned, I can see the backtrace and visually inspect all of the code being executed in the flow.
So, you can see that LBR trace is very powerful. It sure beats single-stepping forward through the code. With LBR you can see the code execution going backwards in time.
But AET is even more powerful. AET offers more selective tracing than other forms of trace, and the trace data is only obtainable via probe mode (i.e. JTAG). Examples of selectively traceable architectural events are interrupts, exceptions, read from model-specific registers (RDMSR), write to model-specific registers (WRMSR), IN/OUT instructions, code/data breakpoints, system management interrupt (SMI), and MWAIT. Overhead depends on the scope of the trace data, but can be huge if all events are captured. AET data can be funneled into system memory (after MRC is complete), or just shortly after reset by funneling into the Micro Storage Controller Trace Buffer (MTB) with the trade-off that this buffer is quite small (4kB) but will nonetheless capture far more instructions than LBR.
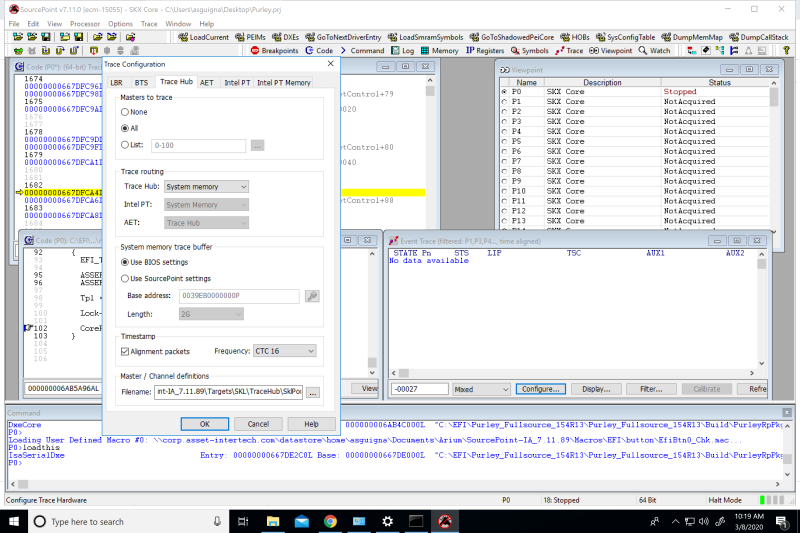
Setting up AET is easy. You first have to configure the Trace Hub to enable AET:
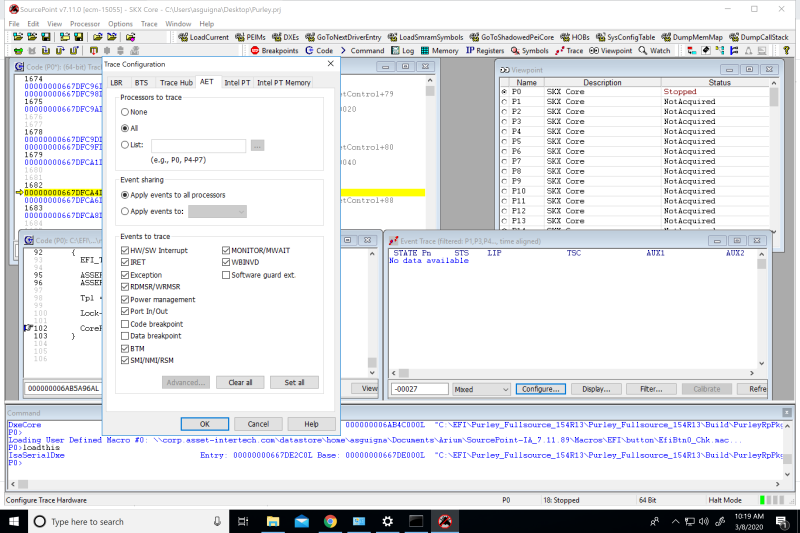
Then, click on the AET tab to trigger on the events that you want:
You can see the power of AET here. It will trigger on the listed events of your own choosing. You can trace HW/SW Interrupts, IRETs, read and write of MSRs, Port80 IN/OUT, and so on. It will even trigger on SGX events. Cool, huh?
Next week, I’ll show AET trace in action, and delve into some of the use cases for its features.


