This week, I decided to do a thorough analysis of how Last Branch Record (LBR) trace works, to see how useful it is in tracing back what might be the root cause of system failures.
LBR trace within SourcePoint displays a history of executed instructions. The last branch recording mechanism tracks not only branch instructions (like JMP, Jcc, LOOP and CALL instructions), but also other operations that cause a change in the instruction pointer (like external interrupts, traps and faults).
The advantage of LBR trace is it is non-intrusive. The processor can run at full speed when using LBR trace. The disadvantage of LBR trace is the limited number of LBRs available (on the Minnowboard BayTrail-I CPU, which is based on the Intel Silvermont core architecture, there are eight). A branch record consists of a branch-from and a branch-to instruction address.
If you assume an average of 5 instructions between branches, then roughly the last 40 instructions executed are traced.
I learned all I know about how LBR works from the Intel Software Developer Manual. Volume 3 deals with how to configure the platform to use LBR. In particular, there are certain registers, such as MSRs IA32_DEBUGCTL[0] and IA32_PERF_CAPABILITIES[5:0], that must be used to activate LBR and define the format of the addresses defined within the LBR stack. And the source and destination instruction addresses of recent branches are contained within MSRs. For example:
MSR_LASTBRANCH_0_FROM_IP stores a source address.
MSR_LASTBRANCH_0_TO_IP stores a destination address.
MSR_LASTBRANCH_TOS contains a pointer to the MSR in the LBR stack that contains the most recent branch, interrupt, or exception recorded.
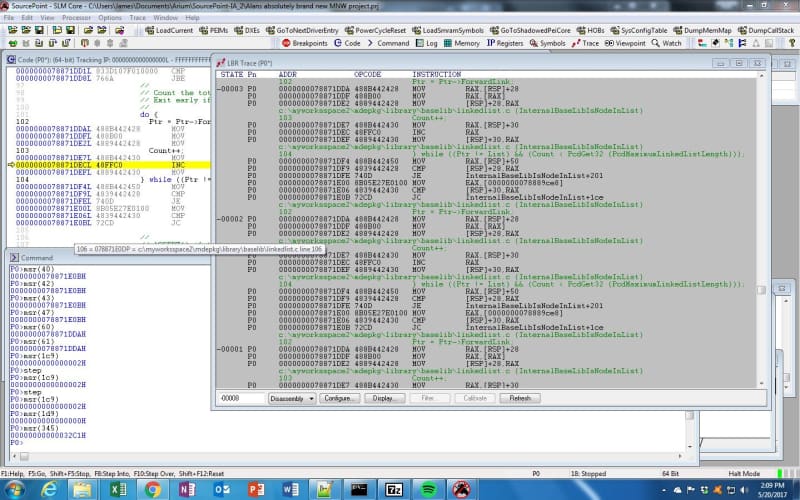
Let’s see how this works within SourcePoint. I booted up the Minnowboard to the UEFI shell and then launched SourcePoint, turned on LBR, and then hit Run. Just as a starting effort, I typed in “pci 00 00 00 –i” into the shell, which provides a verbose display of the PCI config information for bus 0, device 0, function 0, and then halted the processor. I then used the “msr” command to examine some of the content of the LBR MSRs. Here’s what I saw:
The result is fascinating and a real learning experience to delve into.
Firstly, the Code window shows that the instruction pointer is at 78871DEC which is within a “do” loop that is incrementing the value of the “Count” variable.
The LBR Trace window shows the backtrace of what’s happening. You can see the exact ‘C’ program and the function therein that’s being executed at the time the platform was halted. The actual file is at:
C:\myworksspac2\mdepkg\library\baselib\linkedlist.c
and the function we’re in is:
InternalBaseLibIsNodeInList
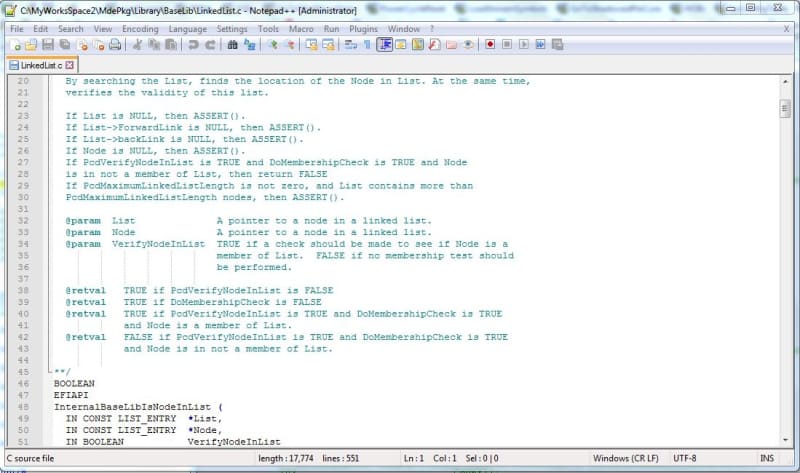
There’s a lot of detail displayed in the Trace window, including the line number within the source code file, and the source/symbols with associated disassembly. It’s pretty cool that I can go back to the source within the build on my PC and see what the purpose of this function is. Here’s an excerpt:
Having access to the comments within the source code really adds to my understanding of what the software is doing.
It’s also fascinating to correlate what is on the SourcePoint screen with the contents of the LBR-related MSRs. As you can see, I ran the SourcePoint “msr()” command on many of the source and destination address MSRs. They are at 78871E0B and 78871DDA respectively. This makes sense; looking at the Trace window, at address 78871E0B is the JC InternalBaseLibIsNodeInList+1ce back to the top of the “do/while” loop, and 78871DDA is the MOV RAX, [RSP]+28 that is the beginning of the first instruction (related to the ‘C’ line Ptr = Ptr->ForwardLink; that is the branch at the top of the “do/while” loop.
This particular LBR traceback isn’t particularly interesting, because we’re just stuck in a loop outputting information to the screen. That’s why all the source and destination addresses don’t change; they just repeat as far back as the limited number of LBR MSRs will allow. In my next blog, I’ll break somewhere more interesting, so we’ll have a more dynamic traceback. I’ll also weave together what we see in SourcePoint with what we see in the source build tree to get the big picture on the value of trace.
And a final word from our sponsor: the beautiful thing about SourcePoint is that it shows the traced instructions in a meaningful context with the code that is currently executing. But, we do know that interrupts, exceptions, and other logic elements running in parallel with the mainline code can contribute to system bugs and failures. For a good eBook on how Trace can be used to track down bugs from parallel and preemptive multitasking execution on Intel-based designs, see our eBook, Hardware Assisted Debug and Trace within the Silicon (note: it’s free, but requires registration).


