In our last episode, we left off just as we were beginning to configure the DDR via a SourcePoint Macro. In the Zedboard Chronicles Episode One, we stated that the code was running in OCM. How did we know that the cores were operating in the OCM?
Was it because the TRM told us? Or was it because the debugger was tracking the program counter and the only code available was in the OCM? Actually it is a little of both and the knowledge gained from Xilinx tools. Here is the connection to the Xilinx tools and the macro development.
To continue with the SourcePoint macro, we do need some information about the address map of the DDR. For that matter, we need information about the total address map of the Zedboard, which is comprised mostly of the Xilinx Zynq-7000 SoC.
Thankfully, when dealing with Zynq designs, the hardware configuration or device map is done within the Vivado tool and can be exported for sharing this data via the system.hdf resource. In this file, you will find, for the Zedboard, the following memory addresses:
Axi_bram 0x40000000 – 0x40001FFF (Block ram)
DDR_0 0x00100000 – 0x1FFFFFFF (DDR Space)
QSPI_0 0xFC000000 – 0xFCFFFFFF (QSPI Space)
Ram_0 0x00000000 – 0x0002FFFF (OCM)
Ram_1 0xFFFF0000 – 0xFFFFFDFF (OCM)
At this point, I like to poke around the different memory regions to see if they are enabled properly by the macro. However, before we examine the various memory spaces, we need to run the macro, and to run the macro it would be helpful if we knew something about the macro language, but I’ll save that discussion for a little later.
With SourcePoint, the user can have as many memory views as necessary to examine multiple regions of the memory address space at the same time. The Memory view, like the Code view, can track the
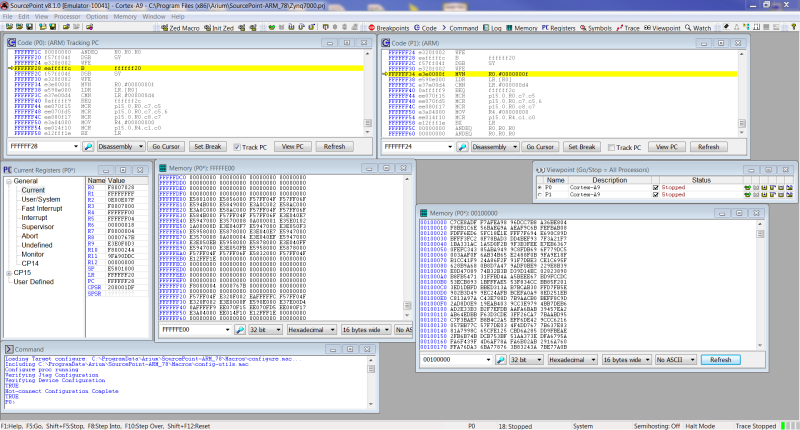
viewpoint or it can track the processor core. After the execution of the macro which initialized the DDR controller, and using the address data above, I opened a view into the DDR and OCM RAM_1. Our experiment worked! Notice that in the Viewpoint we can see that both cores are stopped.
When conducting these types of experiments it is likely that you will open a Memory view into an address region that had not been initialized. When that happens, SourcePoint will throw an exception that can be seen in the Log view. The Memory views will then only display question marks to indicate that memory could not be read.
The question becomes; how will the Zedboard respond to a request to dump memory from a region that is not “visible”? Our experience with the Zedboard shows that the board needs to be power cycled to recover from this catastrophic fault. It is not a design problem, but an operator problem, so be careful with dumping memory. What happens if I launch SourcePoint and have memory views open into known uninitialized memory? I’ll cover that in the next chronicle when I talk about projects and files.
Here is the macro discussion I promised earlier. To better understand the macro language let’s look at the Zed Initialization macro and how it is integrated into the SourcePoint debugger. Looking at a fragment of the macro below, we see the code architecture and how the Zynq-7000 SoC is going to be initialized. There are three different versions of the silicon. In the original script, the script determined the version of the PS.
define proc ps7_init()
{
define ord4 sil_ver;
puts("before si_ver");
sil_ver = ps_version();
puts("after si_ver");
if ( sil_ver == PCW_SILICON_VER_1_0 ) {
ps7_mio_init_data_1_0();
ps7_pll_init_data_1_0();
ps7_clock_init_data_1_0();
ps7_ddr_init_data_1_0();
ps7_peripherals_init_data_1_0();
} else {
if ( sil_ver == PCW_SILICON_VER_2_0 ) {
ps7_mio_init_data_2_0();
ps7_pll_init_data_2_0();
ps7_clock_init_data_2_0();
ps7_ddr_init_data_2_0();
ps7_peripherals_init_data_2_0();
} else {
ps7_mio_init_data_3_0();
ps7_pll_init_data_3_0();
ps7_clock_init_data_3_0();
ps7_ddr_init_data_3_0();
ps7_peripherals_init_data_3_0();
}
}
}
After executing the code, we did determine that our version of the PS was version three, so we shortened the code to just deal with version 3.
define proc init_zed()
{
ps7_mio_init_data_3_0();
ps7_pll_init_data_3_0();
ps7_clock_init_data_3_0();
ps7_ddr_init_data_3_0();
ps7_peripherals_init_data_3_0();
ps7_post_config_3_0();
}
Diving a little deeper into the DDR configuration portion of the macro, we see the following:
define proc ps7_ddr_init_data_3_0()
{
mask_write( 0XF8006000, 0x0001FFFF, 0x00000080 );
mask_write( 0XF8006004, 0x0007FFFF, 0x00001081 );
mask_write( 0XF8006008, 0x03FFFFFF, 0x03C0780F );
mask_write( 0XF800600C, 0x03FFFFFF, 0x02001001 );
To understand what is happening here the user needs to get out the TRM and do some searching. There is a 37-page section of the TRM that deals with the DDR controller. Looking at the macro fragment above I see that we are writing to an address (could be a register), masking off some bits of that address, and writing the data. What we are about to do is reverse-engineer the code to learn about the initialization. For me, I like to take shortcuts, and get to the root of my question as quickly as possible. So I simply search for the address, 0XF8006000, in the TRM. By doing so, I quickly find that this is the base address of the DDR controller. Doing a second search, continuing on from current page, I get to the page with the detail about this register. I see that the data to be written is the 7th bit (0 bit starting index) and that this code is setting the reg_ddrc_rdwr_idle_gap to a 1. Now searching for the register bit name I see the following:
The normal programming condition is expected to be reg_ddrc_prefer_Write=0. (this is a bit field
in the DRAM_param_reg4 register) This means that the read requests are always serviced
immediately when received by an idle controller. Also, it is often desirable to set the
reg_ddrc_rdwr_idle_gap (this field is in the ddrc_ctrl register) to a very low number (such as 0, 1,
or 2) to ensure that writes do not go un-serviced in an otherwise-idle controller for any length of
time, wasting bandwidth. (The trade-off here is that by servicing writes more quickly, the
likelihood increases that reads issued to the controller immediately following writes incurs
additional latency to allow writes to be serviced and turn the bus around.)
So we learn a little about what was done, but not why. That takes more reading and understanding of the DDR controller. There is a lot more to this macro than we are showing here, but the idea to comprehend is that the SoC initialization is a methodical process and the TRM helps guide the user to develop the code flow. Developing this macro from scratch requires that we would read all 37 pages about the DDR controller to create the knowledge for developing the code. About now someone is saying, if I have to do all that why not write the code and just execute that rather than use a macro. This is a really good question. If the code can fit into the OCM then this is a reasonable approach. If it doesn’t fit into OCM then you need an alternate approach, and that is what the macro provides. Besides
SourcePoint ships with macros for the Zedboard and target boards to help accelerate the product development.
Now on to the actual use of the macro.
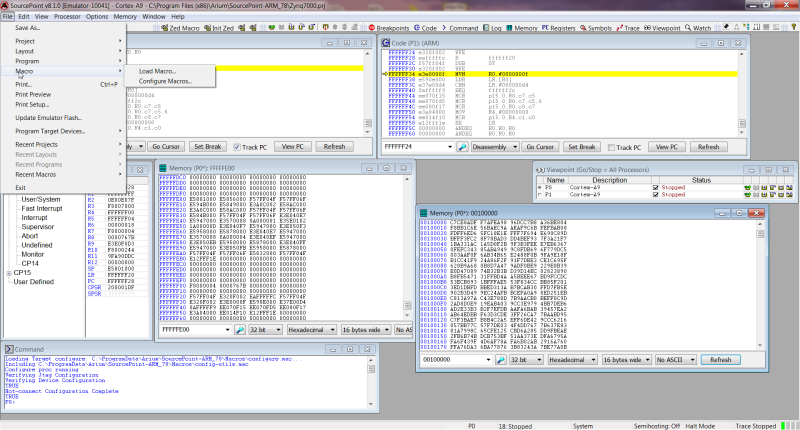
To use this macro, we configure SourcePoint to load the macro under user control via a button within the user interface. To accomplish this, under the File menu (see below), the user can load and configure the macro. Loading the macro, loads the macro within SourcePoint environment. Configuring the macro allows us to assign a command or macro to the button within the user interface.
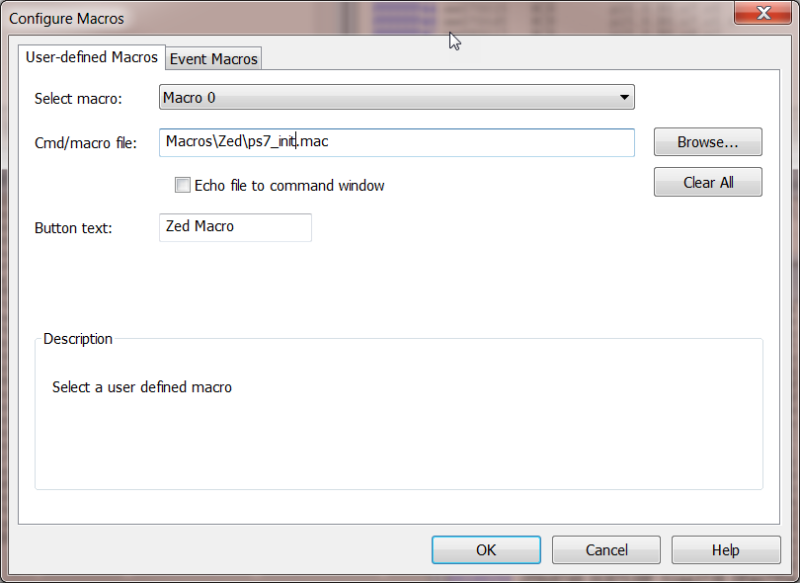
We wanted user control via buttons. By configuring two buttons to control the actions, one to load the macro and the second to invoke the macro. Below are the two examples. First is the example of assigning a button to load the macro and pointing to the macro file name.
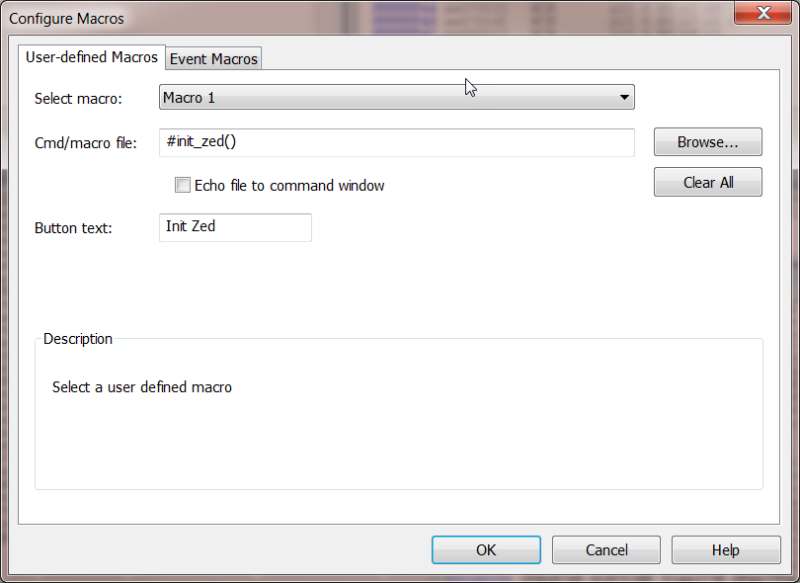
The second example is how to configure a button to invoke the macro.
Once the two actions above have been accomplished the button are added to the user interface of SourcePoint.
This macro is collection of procedures which we looked at earlier.
ps7_pll_init_data_3_0();
ps7_clock_init_data_3_0();
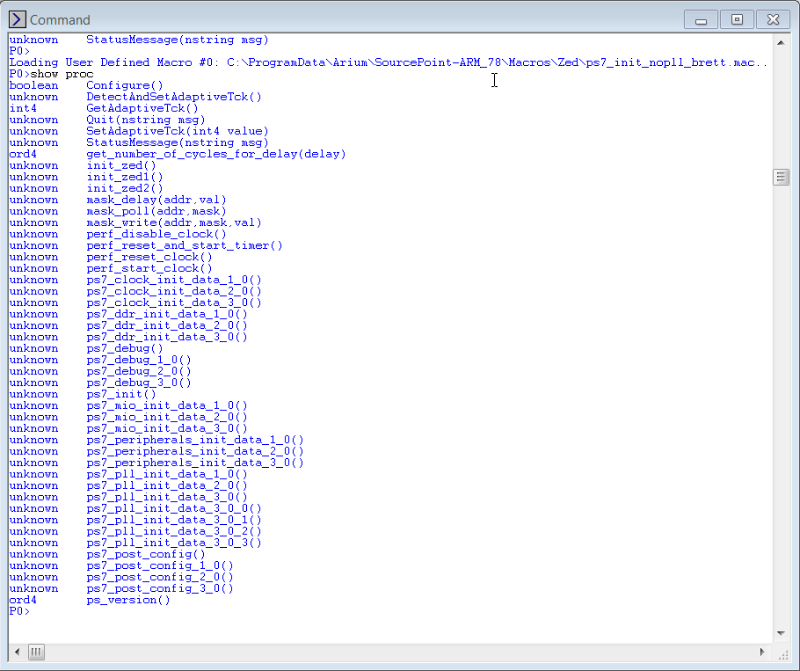
Once the macro is loaded, SourcePoint can display the procedures that are available for execution within the Command view. Even if you didn’t develop the macro, by executing “show proc” in the Command view you get a rundown of available procedures to call.
Using the command view, individual procedures can be executed by the user, such as ps_version() or init_zed(). With this macro, as it was design to handle three different version of the Zynq SoC, care must be taken by the user not to invoke a procedure that is not compatible with the silicon.
There is still so much more to explore in the Xilinx Zynq-7000 SoC like the Multiplex IO (MIO), and peripherals, just to name two, but I’ll cover them in the next Zedboard Chronicles.
If you want to know more about SourcePoint, please feel free to visit our website here. There’s an excellent video of the GUI which shows the ease-of-use and power of the tool on that page. You can also request a live demo here.


