When an x86 system has crashed, gathering forensics data to help diagnose root-cause of the failure is a top priority. But, how is this done if the system has crashed, and OS/BIOS-based application programs cannot access the platform?
In some cases, when all else fails, “bare-metal” techniques are necessary to retrieve system state information which may lead to understanding the source of a failure. This is particularly true of platforms in the telecom, storage and server markets, where high availability is considered very desirable. It is absolutely mandatory within medical, automotive, and industrial control systems, where the cost of failure may be immense.
Intel devices support two main out-of-band (OS/BIOS-independent) access mechanisms for forensics: Platform Environmental Control Interface (PECI), and Intel In-Target Probe (ITP). PECI was originally designed primarily for detection of thermal overheating and fan control, and is quite slow, but does provide some access to model-specific registers (MSRs) and PCI configuration space registers. ITP, on the other hand, uses JTAG and other signals to perform low-level reads/writes within the silicon, is relatively very fast (up to 100X faster than PECI), and provides access to all design, validation and test instrumentation within the Intel chips.
ITP also provides access to a large forensics toolset in the form of the Intel CScripts. This is a group of scripts, written in Python and provided by Intel, which assist in bringing up new hardware and debugging firmware. The CScripts methods range from basic state dump (register and memory dumps) to error injection/logging and sideband-enabled postmortem access. CScripts also provide a standardized methodology for the OEMs and ODMs to retrieve low-level system information. Often, this data can be directly used by OEM/ODM Intel Architecture experts to identify the root cause of a problem; or, the data can be sent to Intel, whose experts may be able to identify some exotic silicon or microcode issue.
The CScripts, and the Python environment supporting them, are used ubiquitously by hardware and firmware engineers working with Intel platforms. Although there are hundreds of separate functions, the “Big 4” CScripts that are most commonly used are:
sysError – extracts and decodes all error registers from each socket
sysInfo – displays decoded CPUID leaves, revision number of code and micro-code patches
sysTopo (formally sysStatus) – displays DDR, PCI, USB, SATA, etc. information
sysDump – dumps MSRs and all other architecturally visible register information.
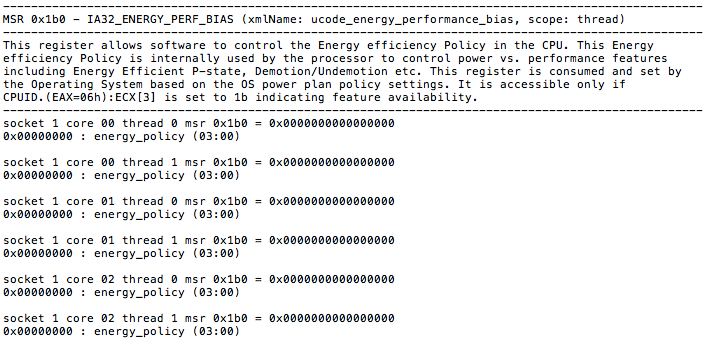
As an example, the msrDump command dumps all known MSRs within a platform. This takes several minutes to run, and a very small subset output example is shown below:
An Intel expert, armed with this information, will go to the Intel® 64 and IA-32 Architectures Software Developer’s Manuals] and look up the definition of this MSR, seeing that it provides support for software “hints” to guide the hardware heuristic of power management features to favor increasing dynamic performance or conservation of energy consumption. Software can program the lowest four bits of the IA32_ENERGY_PERF_BIAS MSR with a value from 0 – 15. The values represent a sliding scale, where a value of 0 (the default reset value) corresponds to a hint preference for highest performance and a value of 15 corresponds to the maximum energy savings.
This is only one example out of literally thousands of use cases. And, of course, the power of Intel CScripts is multiplied exponentially if their capabilities are available in field systems, as opposed to solely in the lab. But, hooking up an Intel ITP to a working field system may be problematic or even impossible. What is needed is in-situ Intel ITP support with full access to the CScripts library immediately when a failure is detected.
This capability is provided by ASSET’s ScanWorks Embedded Diagnostics (SED). SED is an implementation of Intel ITP down on a system’s Baseboard Management Controller (BMC) combined with full support of the CScripts and the Python command environment back at a remote workstation.
A good eBook on the CScripts can be seen here (note, registration is required). For more information on SED, please check out our webpage at http://www.asset-intertech.com/products/embedded-diagnostics, or drop me a note.


