Pop quiz: there are three main mechanisms to access debug embedded instrumentation within Intel silicon. What are they?
XDP Access
The traditional means for doing hardware-assisted debug on Intel designs is via the proprietary 60-pin connector called the XDP (short for eXtended Debug Port). Although it is rather dated, the public Debug Port Design Guide for UP/DP Systems document (June 2006) describes the essence of the JTAG and sideband signals needed to connect to XDP. This classic interface has been in existence for over 10 years, and is well-understood and robust. Its drawbacks include the added cost of the connector on such designs, and often access to the XDP header is precluded because of board obstructions, or simply the inability to acquire access once the platform is on customer premises.
A variation of the XDP60 interface is the MIPI60, which is more predominant on Atom SoC and lower-end client designs. In both the XDP60 and MIPI60 examples, the debug logic which drives the physical connection is named Intel In-Target Probe, or Intel ITP for short.
Access to the XDP60 is “local”; that is, the hardware probe must be within a short distance from the target. The hardware probe connects to the target XDP60 or MIPI60 header with a ribbon cable. “Remote” access to debug facilities on a target requires a remote PC to access a hardware probe physically co-located with the target.
DCI/USB3 Access
As described in my blog A Different Approach to Debug Access, most recent Intel silicon, in addition to supporting XDP, also provides for Direct Connect Interface (DCI) to the target over an existing USB3 port and allows connection of the hardware probe over a standard USB cable. USB3 protocol is not used between the probe and the target; rather, a proprietary protocol allows for high-speed run-control and trace functions to be executed.
This approach greatly simplifies target access, especially when physical access to a target’s XDP header is completely precluded, as in the example of a sealed tablet. But, as the access protocol is proprietary, as with XDP, and short-range, the probe must again be physically co-located with the target.
Embedded ITP
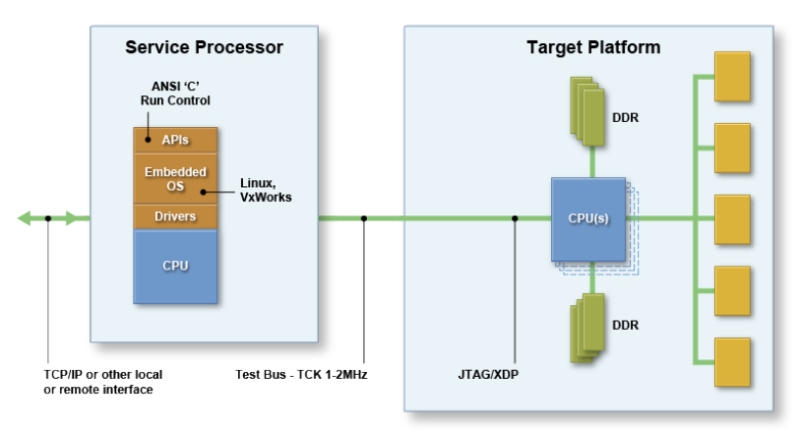
The third approach to debug access is to embed the debug logic locally on the target platform. Named “Embedded ITP”, this places the run-control and trace logic using JTAG and the sideband signals within a service processor (often a Baseboard Management Controller, or BMC) down on the target. It looks like this:
This topology has the advantage of removing any requirements for hardware probes and local probes or related hardware to provide a secure interface back to the debug application.
For lower-end service processors, the maximum TCK sustained frequency is around 1-2 MHz, which is adequate for simple debugging. Some higher-end BMCs, such as the Emulex Pilot 4, have an embedded JTAG Master and are capable of much higher throughput: up to 16MHz, which is comparable to what is achieved via the FPGA within a hardware probe.
More information on Embedded ITP (ASSET’s implementation is ScanWorks Embedded Diagnostics, or SED for short) can be read in our Technical Overview (note: requires registration).


