Conventional printf statements within a BIOS being debugged add a lot of “backpressure” due to the overhead within the printf routine and the cost of directing the output through a slow serial port. This slows the debugging process down, and may even mask some time-sensitive bugs. Is there a better, more non-intrusive way?
Engineers ramping up a BIOS learning curve, or those who don’t have access to more sophisticated tools, often use the printf statement to selectively output the progress of the BIOS execution to assist in platform debug. The code is instrumented to support debug hooks such as DEBUG, RCPRINTF, and ASSERT_EFI_ERROR. These in turn may invoke printf to output data specific to the code context, which might be anything from the current postcode, to the channel, DIMM and rank of memory being initialized.
The problem with this approach is that the printf function itself can be several hundred lines of code, and the BIOS is riddled with calls to it. The performance impact of this mode of operation can be huge, changing seconds of boot time into minutes. The resultant Heisenbugs – software bugs that seem to disappear or alter their behavior when one attempts to study them – render this a very ineffective means of debug, except in the simplest of cases.
These issues can be circumvented when the platform silicon supports a System Trace Macrocell (STM). STM is a newer trace element that can provide event and data value tracing necessary to render and observe changes in the state of the system. Redirecting BIOS debug output to the STM (within x86 systems, the Intel® Trace Hub) virtually eliminates backpressure, and provides the possibility of moving almost all the overhead of printf to the debug tool and outside of the user’s product.
ASSET’s SourcePoint debugger supports an operating mode called “Tool-Hosted Printf” (patent pending), whereby this is achieved. The SourcePoint System Trace Library is utilized within an EDK II build tree for UEFI, taking advantage of the Intel Trace Hub feature. The SourcePoint System Trace Library allows for redirection of multiple debug sources (console output, Management Engine (ME), UEFI debug messages, Architectural Event Trace (AET), etc.) to the Intel Trace Hub, eliminating the need of a console or serial debug port. Tool-Hosted Printf has the provision of only passing parameters (variables) and a pointer to a printf style format string through the Trace Hub, and not the string itself. This is how near-real-time BIOS execution and simultaneous tracing is made possible.
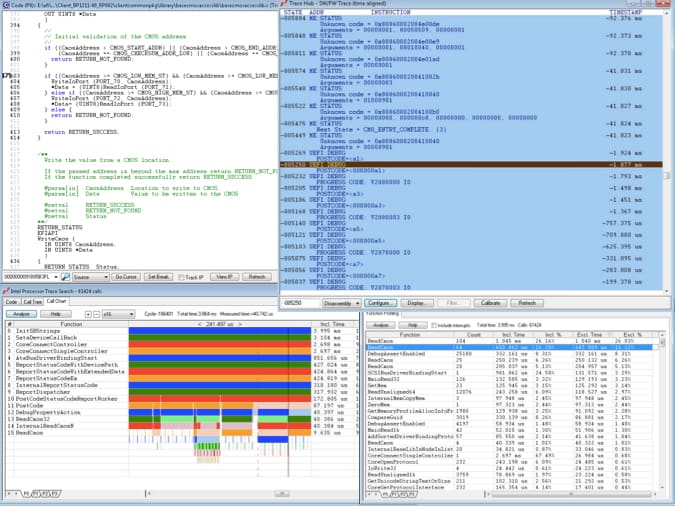
These timestamped BIOS Tool-Hosted Printf’s can be viewed in a complete code context, including Intel Processor Trace, for an extremely powerful debugging platform for Intel designs:
For more information on setting up Tool-Hosted Printf, contact us, or read more at New Methods for Software Debug.


