What is CoreSight, what are its features, and how does it support powerful debug & trace capabilities?
ARM® CoreSight™ enables the debug & trace of the most complex, multi-core SoCs. The architecture is documented within the specifications of its main components:
- ARM Debug Interface (ADI) architecture
- ARM processors real-time trace macrocells (ETM, PTM, STM) architecture
- ARM CoreSight component architecture
- High Speed Serial Trace Port
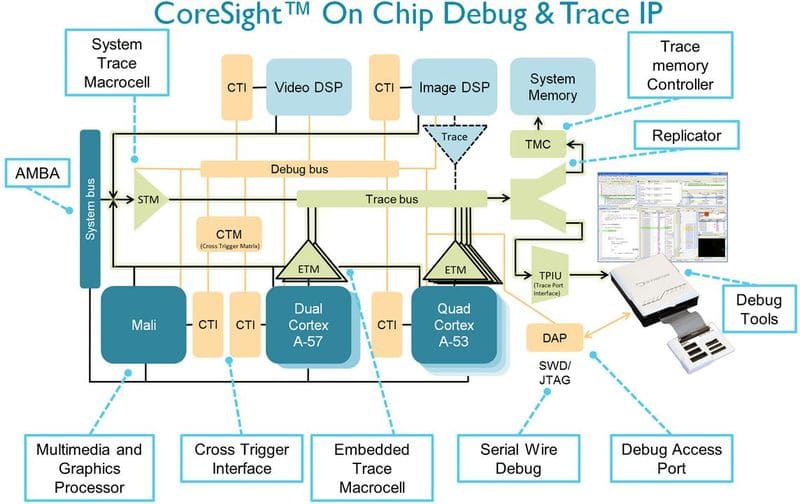
A block diagram for CoreSight on a heterogeneous system is below:
* Diagram courtesy of ARM Holdings, plc.
To begin to understand the technology, a Glossary of Terms for some of the acronyms in the diagram above and commonly-used terms is helpful at this point:
Advanced Microcontroller Bus Architecture (AMBA)
The AMBA family of protocol specifications is the ARM open standard for on-chip buses. AMBA provides solutions for the interconnection and management of the functional blocks that make up a System-on-Chip (SoC). Applications include the development of embedded systems with one or more processors or signal processors and multiple peripherals.
Advanced Trace Bus (ATB)
A bus used by trace devices to share CoreSight capture resources.
Cross Trigger Interface (CTI)
Part of an Embedded Cross Trigger (ECT) device. In an ECT, the CTI provides the interface between a processor or ETM and the CTM.
Cross Trigger Matrix (CTM)
In an ECT device, the CTM combines the trigger requests generated by CTIs and broadcasts them to all CTIs as channel triggers.
Debug Access Port (DAP)
A logic block that acts as a master on a system bus and provides access to the bus from an external debugger.
Embedded Cross Trigger (ECT)
A modular system that supports the interaction and synchronization of multiple triggering events with an SoC. It comprises:
- Cross Trigger Interface (CTI)
- Cross Trigger Matrix (CTM).
Embedded Trace Buffer (ETB)
A logic block that extends the information capture functionality of a trace macrocell.
Embedded Trace Macrocell (ETM)
A hardware macrocell that, when connected to a processor, outputs trace information on a trace port. The ETM provides processor driven trace through a trace port compliant to the ATB protocol. An ETM always supports instruction trace, and might support data trace.
Program Flow Trace Macrocell (PTM)
Implements the Program Flow Trace architecture. Similar to an ETM, but no data gets recorded. Better trace compression than an ETM.
Serial Wire Debug (SWD)
A debug implementation that uses a serial connection between the SoC and a debugger. This connection normally requires a bidirectional data signal and a separate clock signal, rather than the four to six signals required for a JTAG connection.
System Trace Macrocell (STM)
A CoreSight component facilitating more visibility of the SoC and software events in the trace collection memory
Trace funnel
In an ARM trace macrocell, a device that combines multiple trace sources onto a single bus.
Trace Port Interface Unit (TPIU)
Drains trace data and acts as a bridge between the on-chip trace data and the data stream captured by a trace port analyzer.
Trigger
In the context of tracing, a trigger is an event that instructs the debugger to stop collecting trace and display the trace information around the trigger position, without halting the processor. The exact information that is displayed depends on the position of the trigger within the buffer.
In my next blog, I’ll cover the basics of the CoreSight architecture, in the context of a design engineer using tools for software debug. In the meantime, if you would like to read about the ARM version of System Trace Macrocell, a newer, powerful trace element available on some ARM-based devices, I would recommend our eBook: Debug and Trace using ARM System Trace Macrocell (STM).


