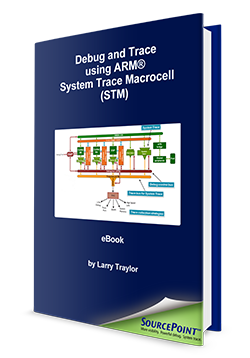
Debugging software for system-on-a-chip (SoC) devices has never been so challenging, as Larry Traylor, ASSET’s vice president of software debug and trace for Arium tools, points out in a newly published eBook. Software developers trying to figure out the root causes of bugs in complex multi-threaded software environments for systems with multiple heterogeneous processor cores each simultaneously running its own thread have got to be shaking their heads these days. Of course, then you’ve also got to consider the changing power states to multiple low-power modes and various active clock domains. The long and short of it all is that it’s very tough for the engineer to know the state of the system when a bug happens. Sophisticated trace tools help a bunch, but some application processors don’t even support trace.
 Larry’s new eBook, titled “Debug and Trace Using System Trace Macrocell (STM),” explains why the relatively new STM is a game changer. It can trace various types of events and provide data from different places in the SoC. As a result, system states are much more visible and, consequently, the cause of a catastrophic bug becomes more apparent. According to the eBook: “The old model of simply tracing the executed instruction stream is far from sufficient for understanding what is going on within the SoC.”
In addition, the eBook describes a new type of trace tool capability which vastly improves the performance of code that has been instrumented for STM trace. Larry calls this innovation tool-hosted printf.
Don’t miss out on this valuable eBook, "Debug and Trace using ARM® System Trace Macrocell (STM)". Download it today!


