
I’ve always been interested in how interrupts work on x86 targets. Using JTAG with our SourcePoint debugger, I’ve explored the behavior of interrupt dispatching internals in a new way. This article describes the functionality of the Interrupt Descriptor Table (IDT) as an Intel target is booted from the reset vector, through UEFI, and into Windows.
Recently, I read a really interesting article on Interrupt Dispatching that piqued my interest in having a look at interrupt low-level behavior using SourcePoint. As usual, I learn something new every time I delve into some new aspect of x86 using JTAG.
SourcePoint has the unique capability of displaying the Interrupt Descriptor Table (IDT) in a very visual way, and looking at the code of the interrupt service routines, setting breakpoints therein, etc.
So, let’s begin….you can follow along if you have a copy of our debugger.
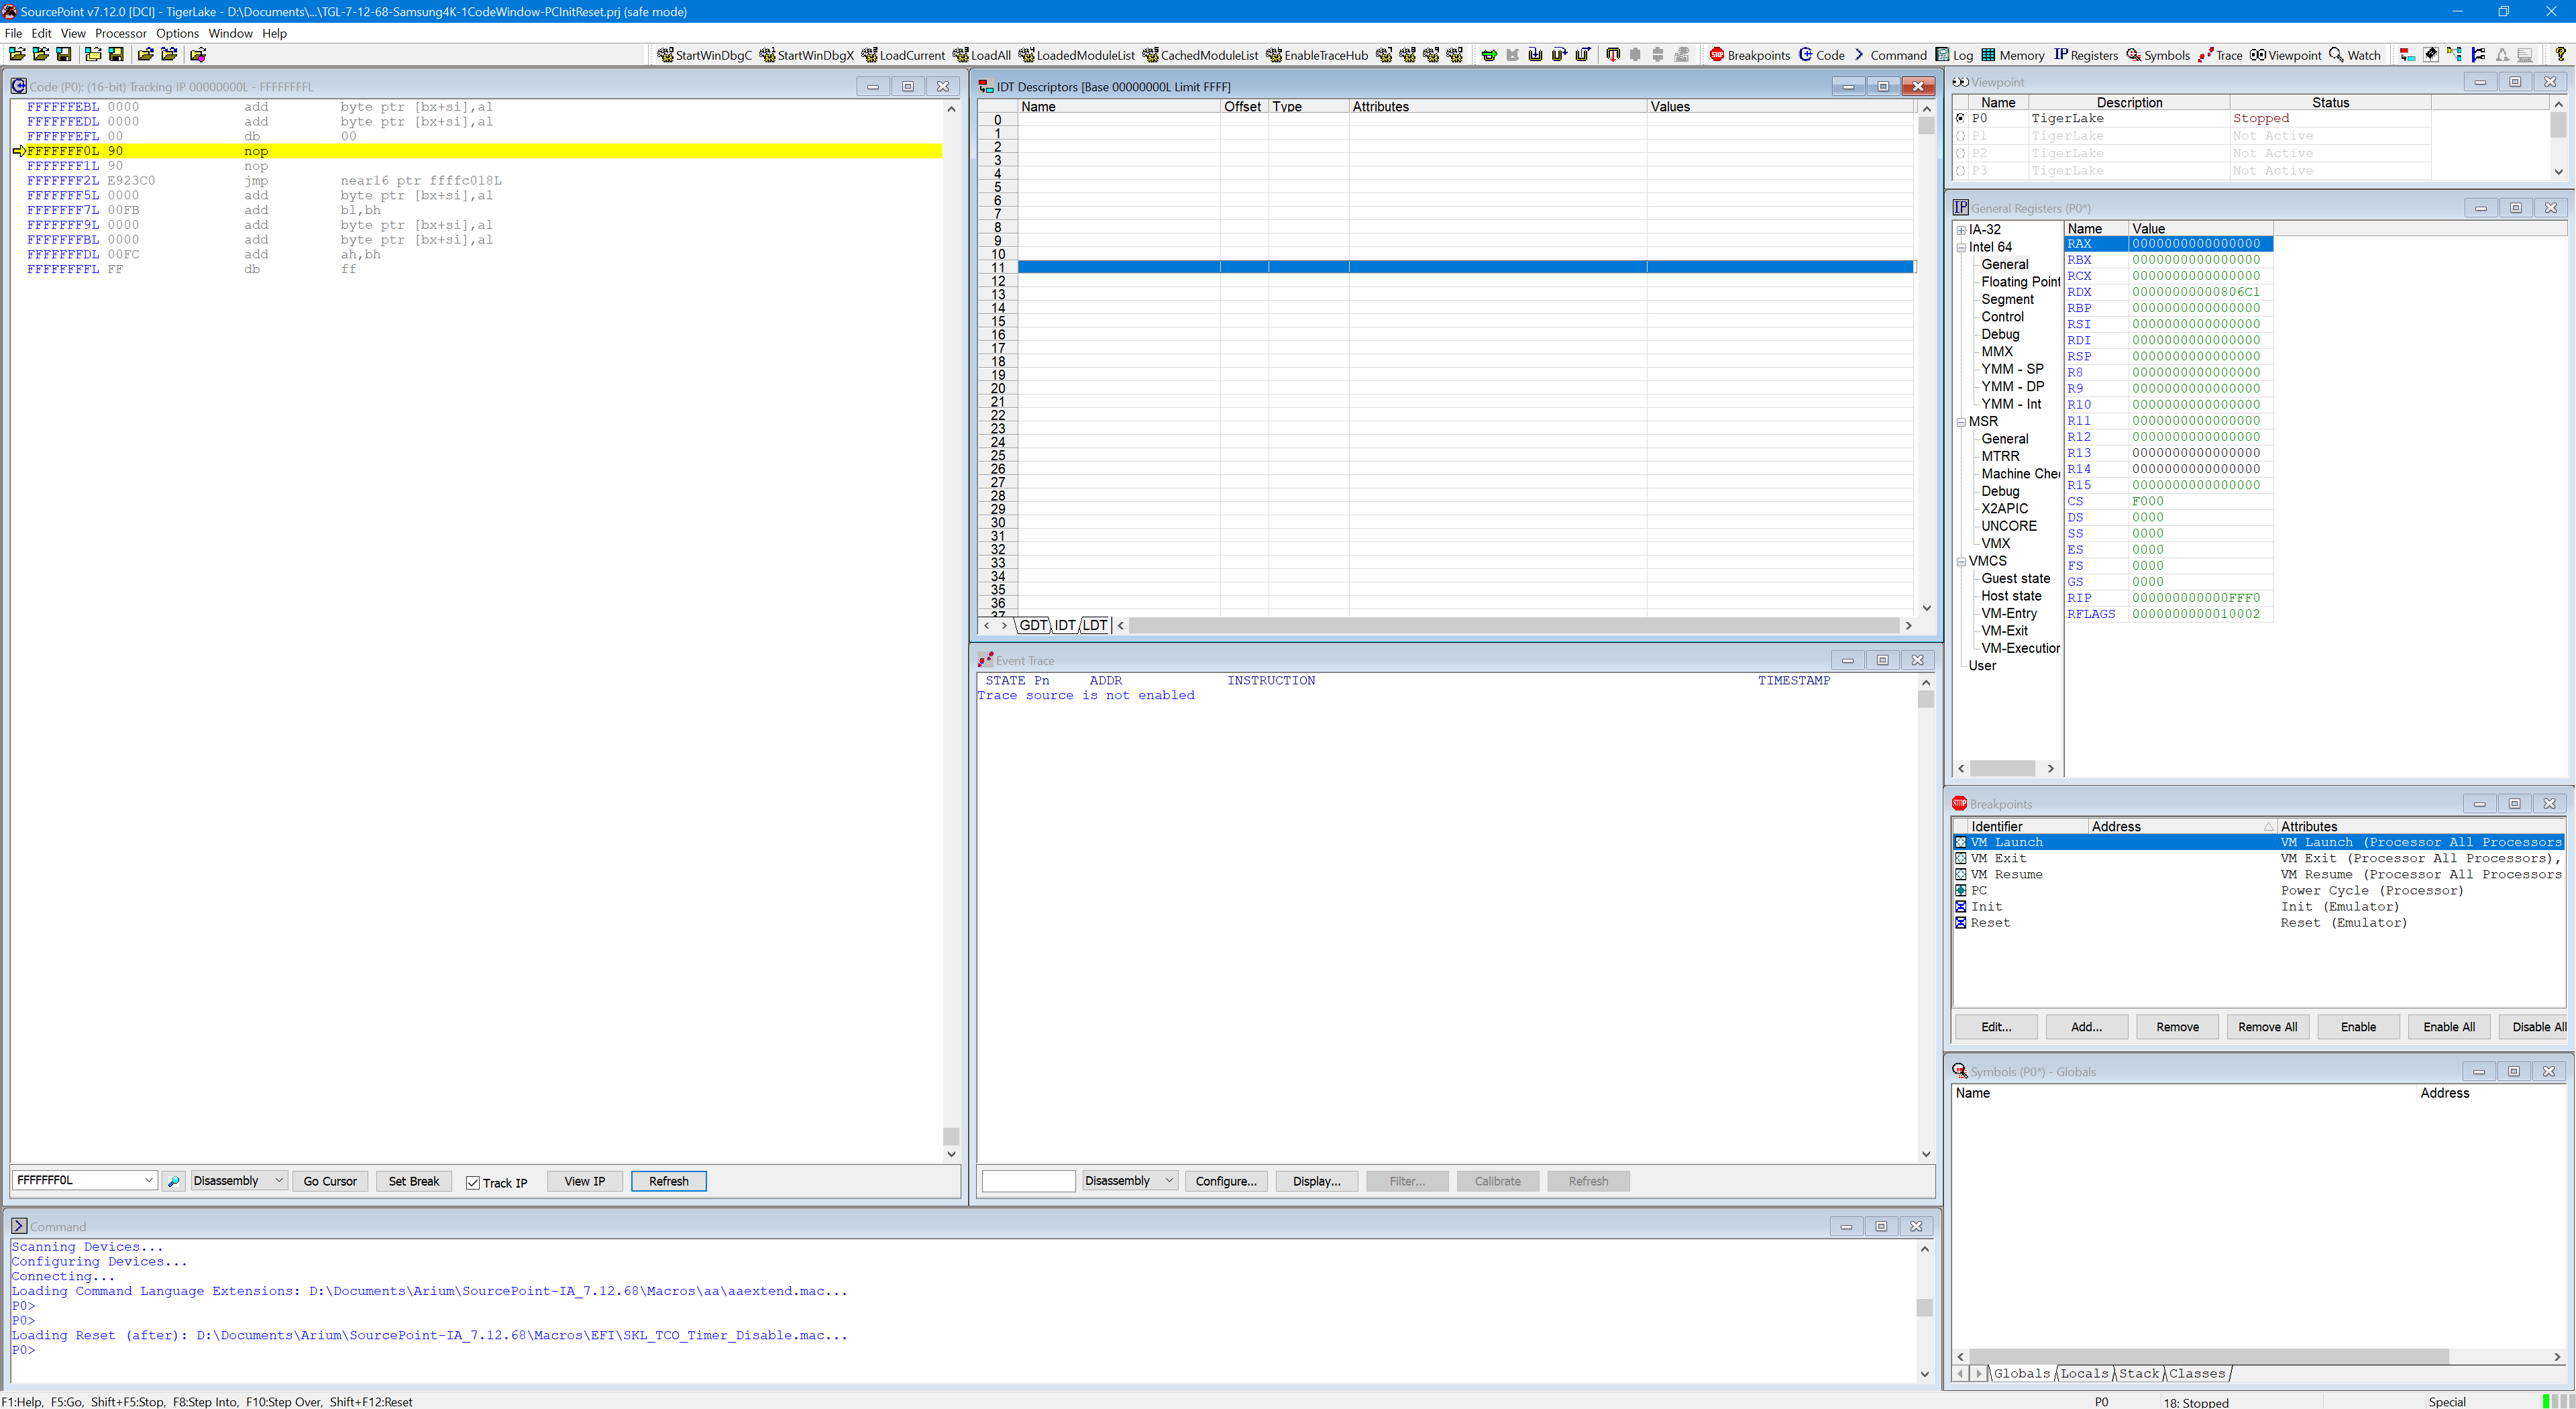
Using SourcePoint to reset the target and halt at the reset vector, you can see that the IDT table is empty, since it has not been defined yet:
Hit Go. Wait one second. Hit Stop. You’ll see something like this:
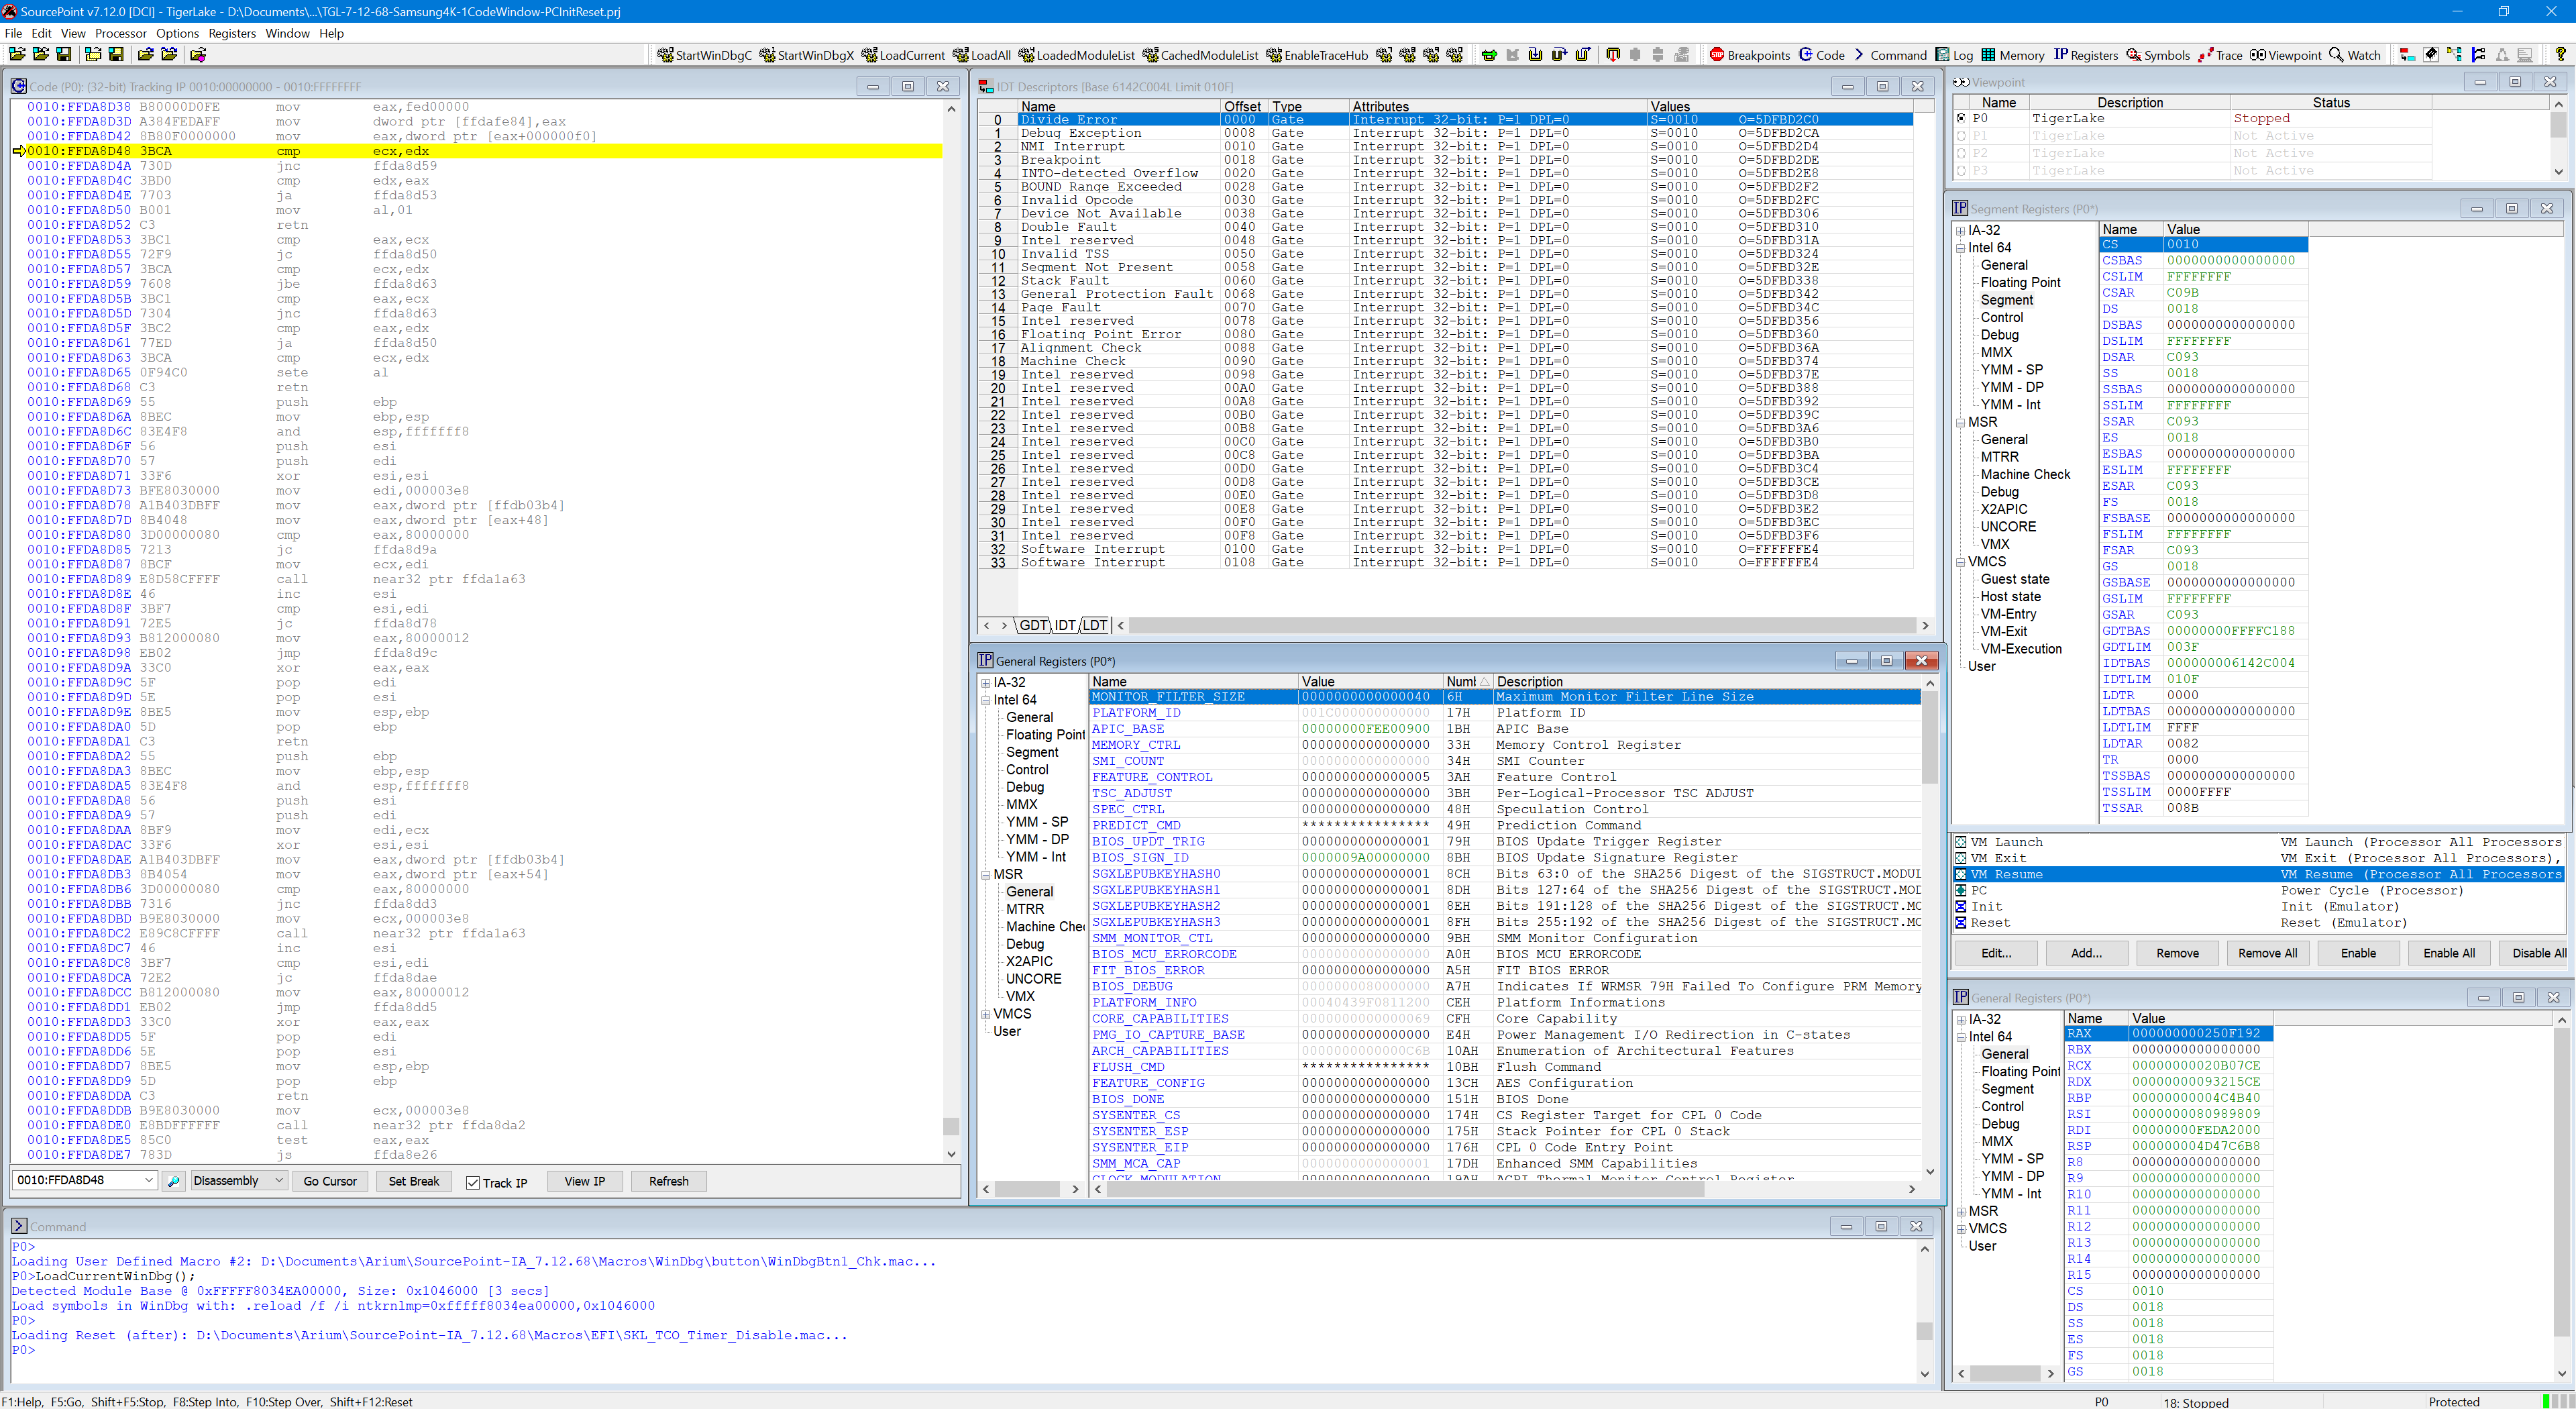
The target is in protected mode, at 0010:FFDA8D48, as you can see from the Code window. This address is random, of course, based on the stopping point. SourcePoint tells you the mode the target is in down at the bottom right, where “Protected” and “Stopped” can be seen.
The IDT is now populated, up to index decimal 33, or x’21’.
Interestingly, the last two entries are bogus. Memory hasn’t been initialized yet.
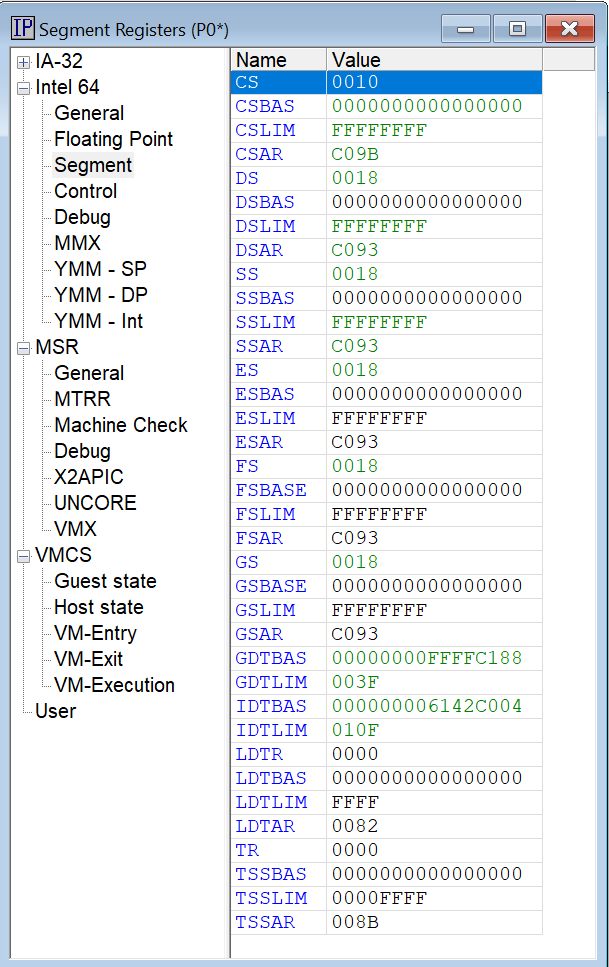
From the IDT Descriptors window Title Bar, note that IDTBAS is x’6142C004, and IDTLIM is x’10F at this part of the boot process. You can also see the value of these registers within the SourcePoint Registers window, and select Segment:
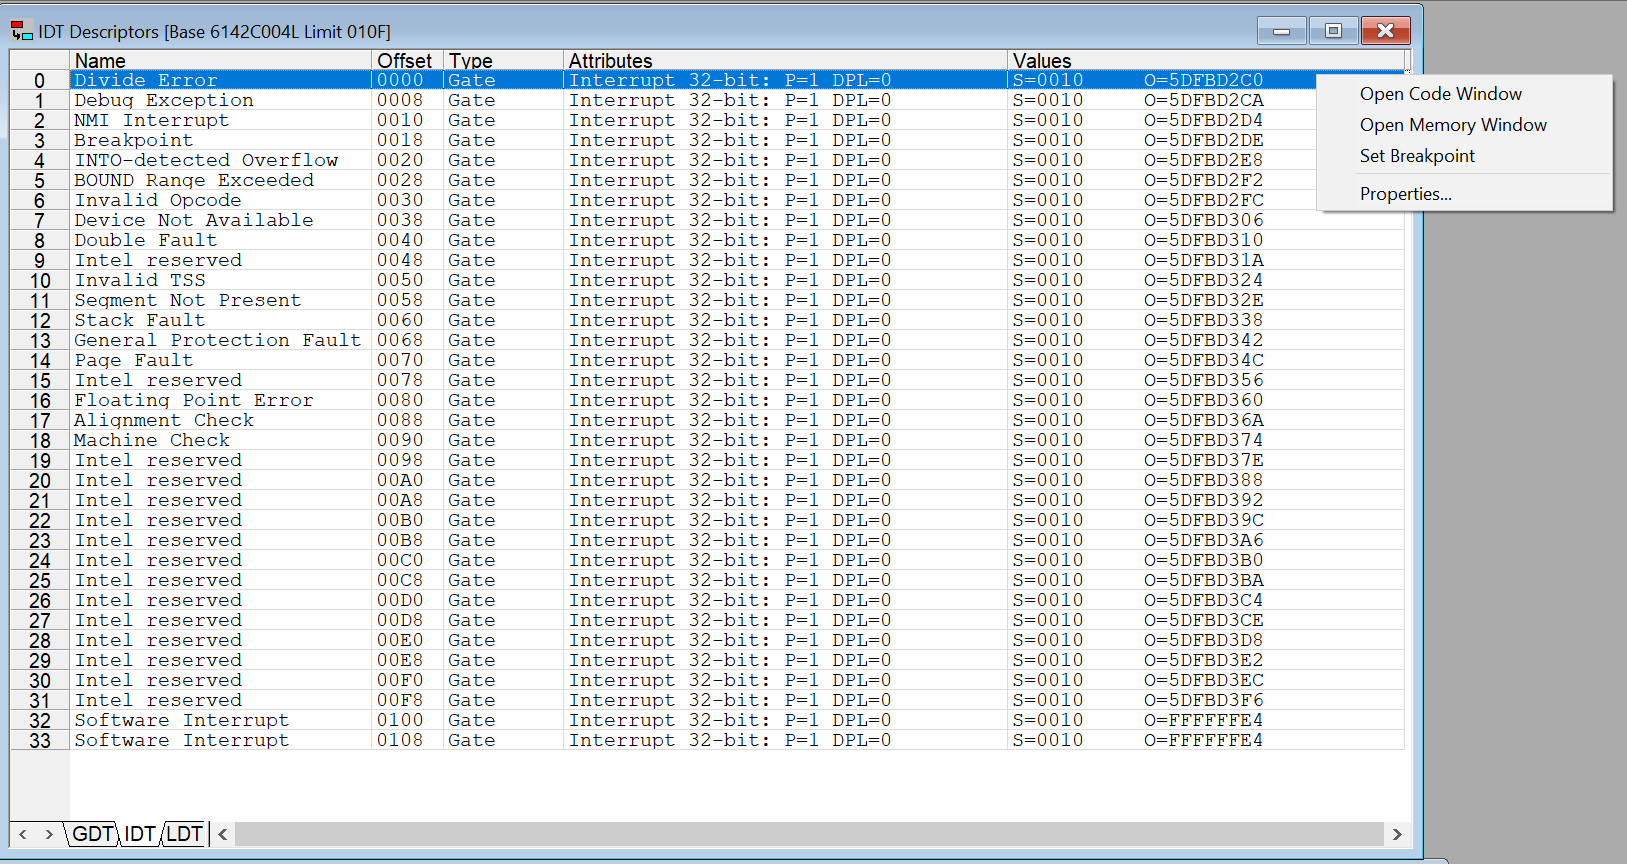
Following the steps above, on this Tiger Lake board, the interrupt handlers are always at the same addresses: in this case, the Divide Error routine begins at x’5DFBD2C0. IDTBAS, IDTLIM and the interrupt handler entry points are always the same, from boot to boot.
It is possible to see the code associated with the interrupt handler, and set a breakpoint at it, by right-clicking:
Now hit Go within SourcePoint, and hold down the F7 key to stop at the UEFI password prompt. Hit Stop.
At the UEFI shell, the IDT looks like this:

To make it more readable, the text in SourcePoint’s IDT Descriptors table, in table form, for the first part of the IDT is as follows:
| Name | Offset | Type | Attributes | Values |
| Divide Error | 0000 | Gate | Interrupt 64-bit: P=1 DPL=0 IST=0 | S=0038 O=00000000_640DE018 |
| Debug Exception | 0010 | Gate | Interrupt 64-bit: P=1 DPL=0 IST=0 | S=0038 O=00000000_640DE027 |
| NMI Interrupt | 0020 | Gate | Interrupt 64-bit: P=1 DPL=0 IST=0 | S=0038 O=00000000_640DE036 |
| Breakpoint | 0030 | Gate | Interrupt 64-bit: P=1 DPL=0 IST=0 | S=0038 O=00000000_640DE045 |
| INTO-detected Overflow | 0040 | Gate | Interrupt 64-bit: P=1 DPL=0 IST=0 | S=0038 O=00000000_640DE054 |
| BOUND Range Exceeded | 0050 | Gate | Interrupt 64-bit: P=1 DPL=0 IST=0 | S=0038 O=00000000_640DE063 |
| Invalid Opcode | 0060 | Gate | Interrupt 64-bit: P=1 DPL=0 IST=0 | S=0038 O=00000000_640DE072 |
| Device Not Available | 0070 | Gate | Interrupt 64-bit: P=1 DPL=0 IST=0 | S=0038 O=00000000_640DE081 |
| Double Fault | 0080 | Gate | Interrupt 64-bit: P=1 DPL=0 IST=0 | S=0038 O=00000000_640DE090 |
| Intel reserved | 0090 | Gate | Interrupt 64-bit: P=1 DPL=0 IST=0 | S=0038 O=00000000_640DE09F |
| Invalid TSS | 00A0 | Gate | Interrupt 64-bit: P=1 DPL=0 IST=0 | S=0038 O=00000000_640DE0AE |
| Segment Not Present | 00B0 | Gate | Interrupt 64-bit: P=1 DPL=0 IST=0 | S=0038 O=00000000_640DE0BD |
| Stack Fault | 00C0 | Gate | Interrupt 64-bit: P=1 DPL=0 IST=0 | S=0038 O=00000000_640DE0CC |
| General Protection Fault | 00D0 | Gate | Interrupt 64-bit: P=1 DPL=0 IST=0 | S=0038 O=00000000_640DE0DB |
| Page Fault | 00E0 | Gate | Interrupt 64-bit: P=1 DPL=0 IST=0 | S=0038 O=00000000_640DE0EA |
| Intel reserved | 00F0 | Gate | Interrupt 64-bit: P=1 DPL=0 IST=0 | S=0038 O=00000000_640DE0F9 |
| Floating Point Error | 0100 | Gate | Interrupt 64-bit: P=1 DPL=0 IST=0 | S=0038 O=00000000_640DE108 |
| Alignment Check | 0110 | Gate | Interrupt 64-bit: P=1 DPL=0 IST=0 | S=0038 O=00000000_640DE117 |
| Machine Check | 0120 | Gate | Interrupt 64-bit: P=1 DPL=0 IST=0 | S=0038 O=00000000_640DE126 |
| Intel reserved | 0130 | Gate | Interrupt 64-bit: P=1 DPL=0 IST=0 | S=0038 O=00000000_640DE135 |
| Intel reserved | 0140 | Gate | Interrupt 64-bit: P=1 DPL=0 IST=0 | S=0038 O=00000000_640DE144 |
| Intel reserved | 0150 | Gate | Interrupt 64-bit: P=1 DPL=0 IST=0 | S=0038 O=00000000_640DE153 |
At this stopping point, IDTLIM is x’0FFF, IDTBAS is x’62A1B018, and the Divide Error interrupt error handler address is x’640DE018. These stay consistent, from boot to boot.
Now let’s boot to Windows and see how things change.
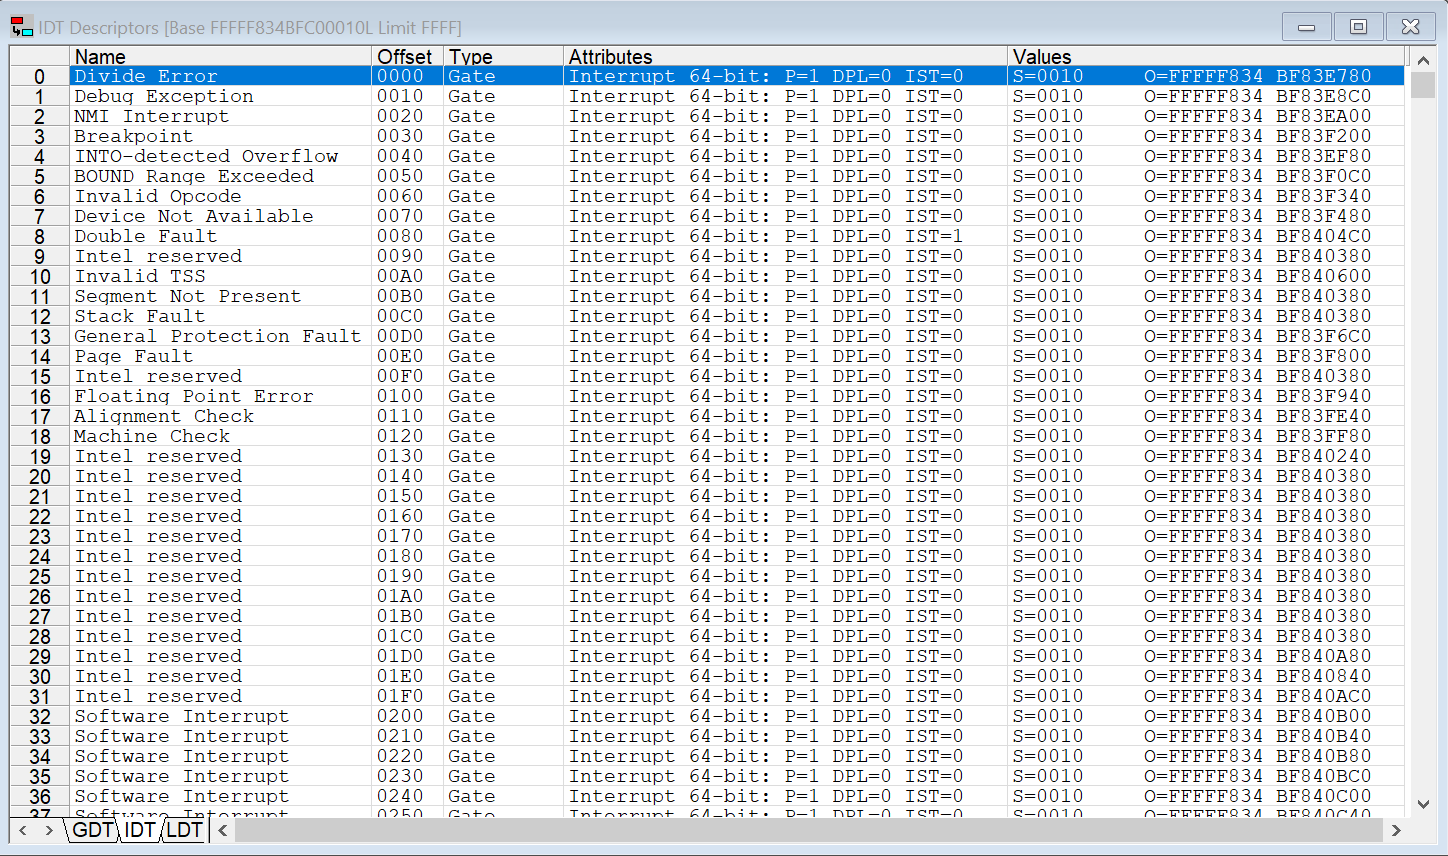
Upon the first halt, at the Windows desktop, the IDT looks like this:
And the Segment Registers look like the below:
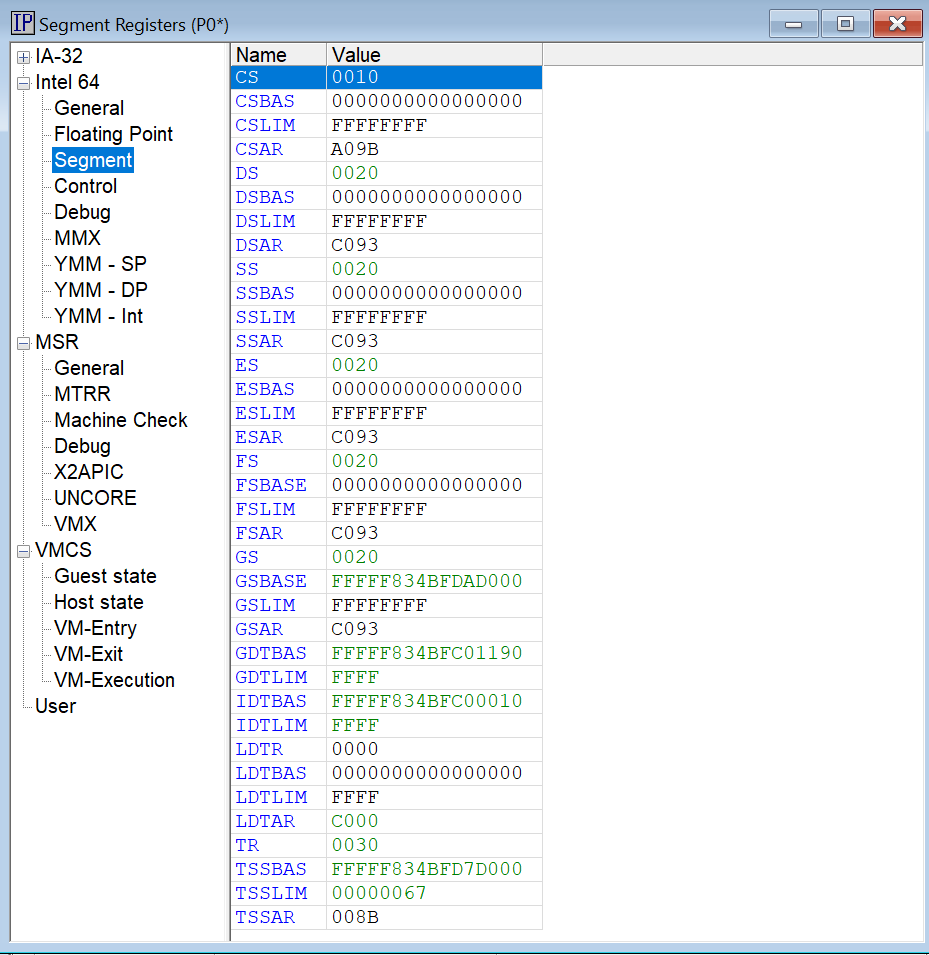
A really interesting thing is that when I took this snapshot, the IDTLIM is x’FFFF. The target is in Host mode (in hvix64). According to the Intel Software Developers Manual (SDM), the maximum IDTLIM should be x’FFF.
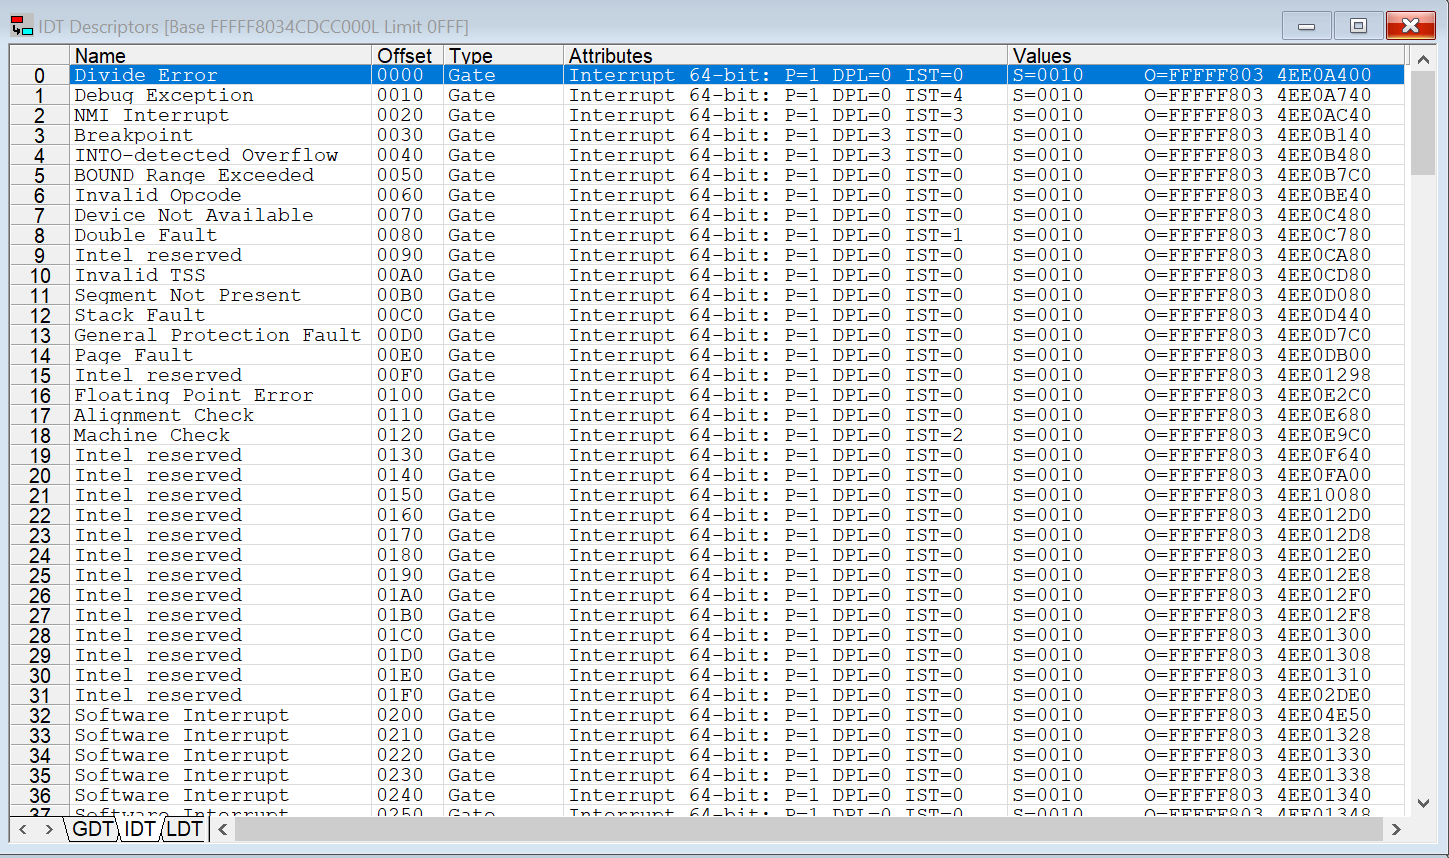
Setting a VM Resume breakpoint and landing in Guest mode sets IDTLIM to the expected x’FFF:
I’ll write some more about this in an upcoming blog. In particular, I’ll look at setting interrupt handler breakpoints at various stages of the boot process and capturing some trace data (LBR trace, and Intel Processor Trace) when the breakpoints are hit.
Interested in learning more about SourcePoint and some of its unique features? I’d recommend watching my prior webinar on Hyper-V debug here.