As everyone who works with server designs knows, Intel publishes a group of JTAG-based scripts called the Intel Customer Scripts (ICS, or CScripts for short). The CScripts are derived from internal applications that Intel uses for silicon validation, and they are enormously useful for board bring-up and debug. This week, I took a look at them, and ran some with SourcePoint.
The CScripts provide a set of Python-based utilities to validate hardware designs, and are used throughout the lifespan of Intel products. They are provided to the OEMs and ODMs to ease the task of bringing Intel-based products to market by enhancing the board bring-up and debug experiences, and can be used to triage issues anytime an error occurs. Most notable are errors variously known as CATERR, IERR, MCERR or three-strike; where often Intel’s assistance is needed to diagnose the root cause. Utilities like “crashdump” are extremely valuable in this respect. But, CScripts come in all shapes and sizes, and are grouped roughly in categories of routines:
Analysis
BIOS
Chipset
Error Dump
Error Injection
Machine Check Banks
Memory Controller
PCI/PCIe
Uncore
UPI
and so on.
Just looking at these categories, you can see that they are very powerful. There’s a utility for just about every need when it comes to hardware/firmware triage. It’s a debugging engineer’s heaven.
To run the CScripts, you need a JTAG-based x86 debugger like SourcePoint. It takes a bit of setup and configuration work to get the CScripts to run in the SourcePoint environment. Specifically, Python, pyreadline, six, enum34, pyparsing and pythonnet need to be installed. Then, the CScripts environment is initialized within the SourcePoint command window by typing:
> python
> arium.runfile(r”<path>\startCScripts.py”)
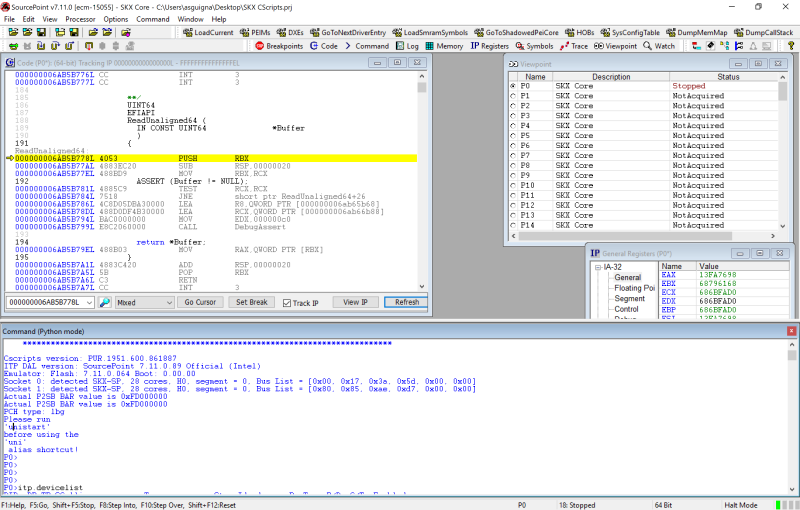
And that’s it. The Python/CScripts environment will launch, and you have all the power of the command line and applications at your fingertips:
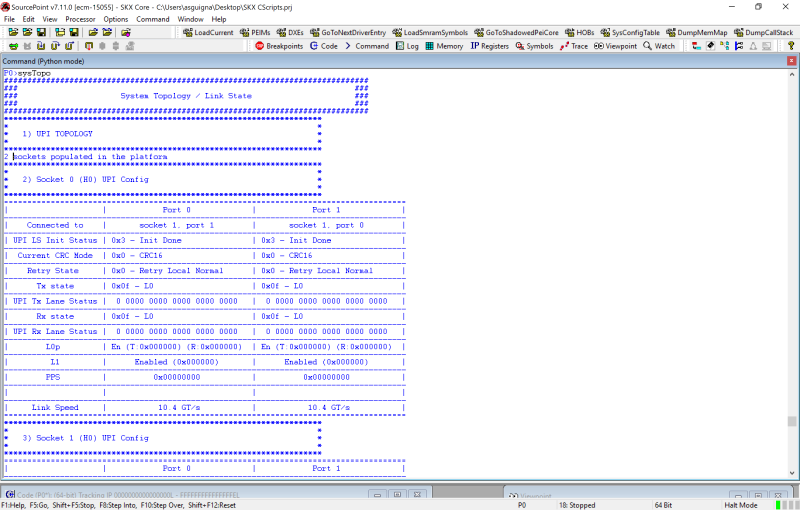
One of the simplest commands is “sysTopo”, that executes all system topology functions. Just by typing “sysTopo” at the Python command line, here’s the first screen of the output:
There’s a lot more to cover, and I’ll have to tackle more about this topic later. But you can see how powerful a combination of source-level debugging with the ability to have Python “plug-ins” is. It reminds me a little of IDA Pro.
Want to know more about the CScripts? Check out our eBook here: Intel Debug using Python CScripts.


