In the first and second episodes of this series, I did a basic introduction of how to set up AET and to trace I/O reads and writes. This week, I look at tracing all Model Specific Register (MSR) reads and writes.
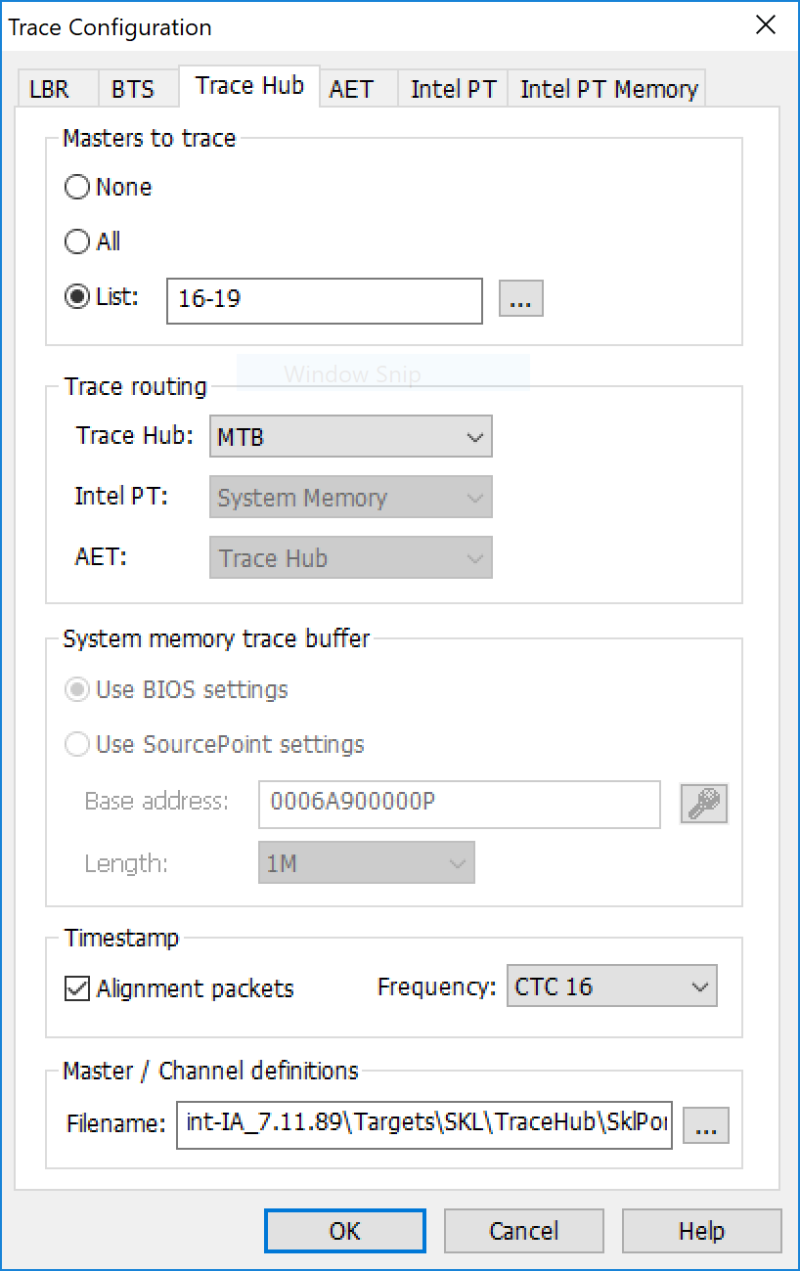
Just as a refresher, once PCI is initialized and before the Trace Hub is hidden, you can initialize it, select the Masters to trace (AET is 16-19), and route the trace to the Micro Storage Controller Trace Buffer (or MTB for short):
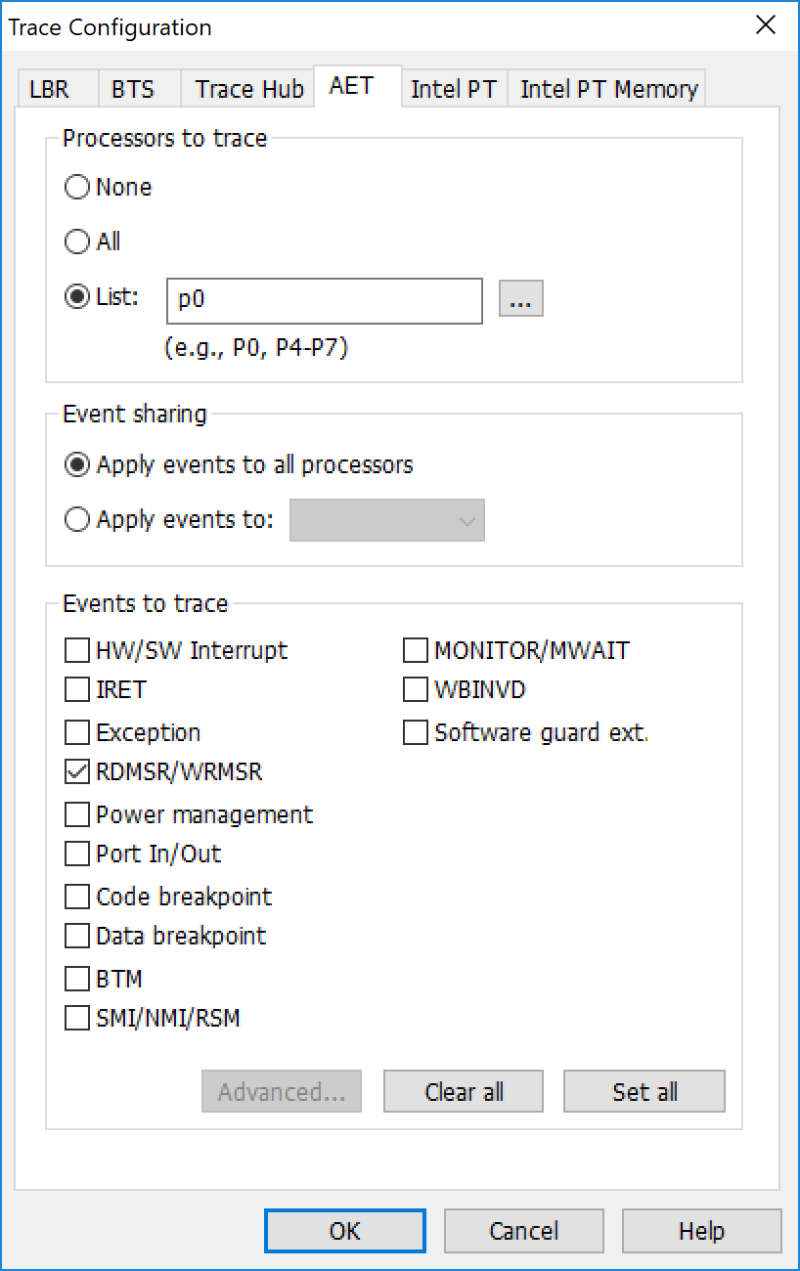
Then, configure the AET. We’ll start with tracing only RDMSR/WRMSR (Read and Write MSR instructions):
Then, run the target, and then halt it where you want – you could do this with a breakpoint, or just hit the Halt button:
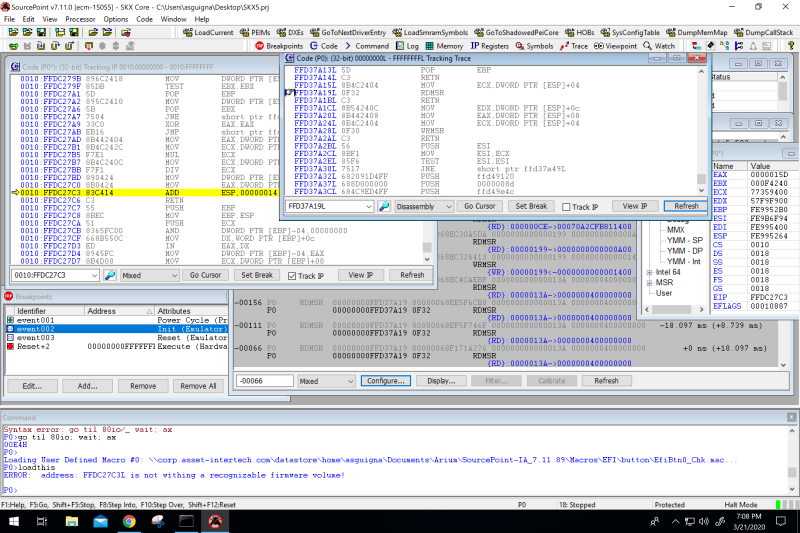
There’s a lot of information on the screen: let’s cover each of the windows in turn.
In the Code window in the top left, you see that I’ve arbitrarily stopped the target at 0010: FFDC27C3. We’re in Protected Mode. Even though I’ve done a SourcePoint “loadthis” to try to map to source code, I’ve had no luck; we’re deep in early platform initialization, for which we don’t have the source in this build, so all we see are the disassembled instructions.
In the Event Trace window (the window with the gray in the middle), we’ve captured all previous MSR reads and writes that fit into the 4kB MTB. The first one is a RDMSR at 18.097ms prior to the current instruction, and is at address FFD37A19. Note that the instruction pointer (in the Code window) is at FFDC27C3. The opcode for RDMSR is 0F32. The RDMSR instruction reads the contents of a 64-bit model specific register (MSR) specified in the ECX register into registers EDX:EAX. Even though the ECX register shows as x’77359400’ in the Registers window on the right, you can’t count on that being the correct value for ECX at the time of the RDMSR; it could have changed between the actual time the RDMSR was about to be done and the actual processor halt. Fortunately, SourcePoint tells us that the contents of MSR x’13A’, which was x’400000000’ were read into the EDX:EAX.
Unfortunately, reading through the publicly available Intel Software Developer’s Manual doesn’t tell us much about this; the x’13A’ MSR is not defined there. But, you can find a reference to MSR x’13A’ here: https://reverseengineering.stackexchange.com/questions/20316/undocumented-msr-machine-specific-register. And there are references to this MSR within GitHub: it’s called out as MSR_BOOTGUARD in various places.
Four more events up higher, there’s a write to MSR x’199. This MSR is documented in the Intel Software Developer’s Manual as IA32_PERF_CTL. To wit:
There may be phases of software execution in which system software cannot tolerate the non-deterministic aspects of opportunistic processor performance operation. For example, when calibrating a real-time workload to make a CPU reservation request to the OS, it may be undesirable to allow the possibility of the processor delivering increased performance that cannot be sustained after the calibration phase. System software can temporarily disengage opportunistic processor performance operation by setting bit 32 of the IA32_PERF_CTL MSR (0199H), using a read-modify-write sequence on the MSR. The opportunistic processor performance operation can be re-engaged by clearing bit 32 in IA32_PERF_CTL MSR, using a read-modify-write sequence.
Also, interestingly, near the top, there’s a read of MSR x’CE’, which is referred to in the SDM as MSR_PLATFORM_INFO. The fields are described therein; have a look if you’re interested. There’s also a reference there to www.biosbits.org for more information, but I haven’t spent any time in there yet; biosbits looks like a dated site.
GitHub is of course always a good resource to look around in for how these are used. And if you have the source code and access to the Intel documentation, AET offers an unparalleled means of tracking the code execution and identifying the root cause of any bugs.
If I put my cursor on the last RDMSR from x’13A’ and right-click and open up a Tracking Trace window, you can see the code around the actual RDMSR in address FFD37A19. This is extremely helpful in understanding the context of the actual MSR read.
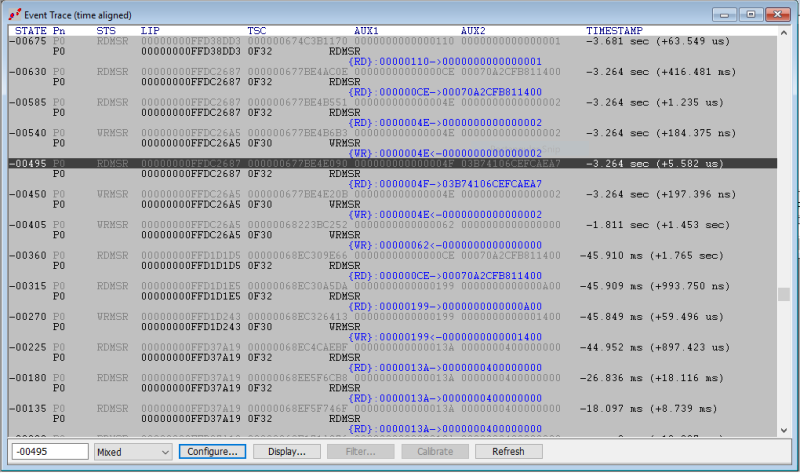
If you look at an expanded view of the Event Trace window, you can see how “sparse” the MSR reads/writes are. Near the platform halt, they are pretty tight together, 10-20 milliseconds apart; then a long break of over a second:
This is something to keep in mind when using AET or other trace sources to the Trace Hub. If you’re looking for a particular event, and are tracking multiple trace sources, the one you’re looking for can get swamped and missed if the trace buffer overflows. It takes some practice to do this right. For example, MSR reads/writes might be coming 20 milliseconds apart, but port I/O might be showing up every three microseconds. I’ll elaborate in a future blog.
As I write this blog, I’m coming to realize that it’s going to take several more episodes to do this topic justice. AET by itself supports a rich set of trace events, as you can see from the top diagram. I mean, who hasn’t at one time wanted to capture a rogue HW/SW Interrupt, IRET, Exception, SMI, etc. etc. And, AET is just one trace facility that goes through the Intel Trace Hub; ITH is capable of tracing messaging from the Management Engine (ME), also known as the Converged Security and Management Engine (CSME); as well as redirecting debug messages (printf statements) coming from the BIOS itself. This latter facility is extremely powerful in that it reduces boot times and eliminates the backpressure and slowdown from printf. Stay tuned for more information on this.


