In this week’s episode, I build some additional Yocto Linux images, beyond simply the minimal base image. Then I start having some fun debugging them.
In Episode 32 of the MinnowBoard Chronicles, I finally (after weeks of intermittent work) got a minimal image built and installed on the Minnow. This was a joyous occasion; and I can thank the new tutorial on the MinnowBoard site, Installing Yocto 2.4.1 Poky, by |\/|ark (alias Mark van der Pol of Intel) for the help.
After I built the core-image-minimal, I got to thinking about building larger images, with more functionality. One of these is the Sato image, that has an optional UI that is based on GTK+.
The image built cleanly, and I used the same approach as in Episode 32 to copy the bootable image onto a USB stick.
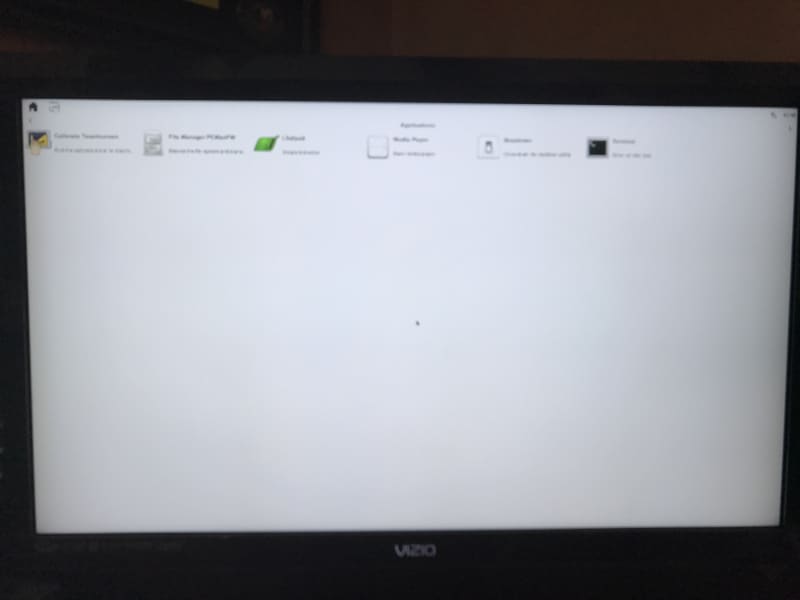
I was excited to see, at the end of the scrolling print statements, a fullscreen launch of the Yocto project come up:
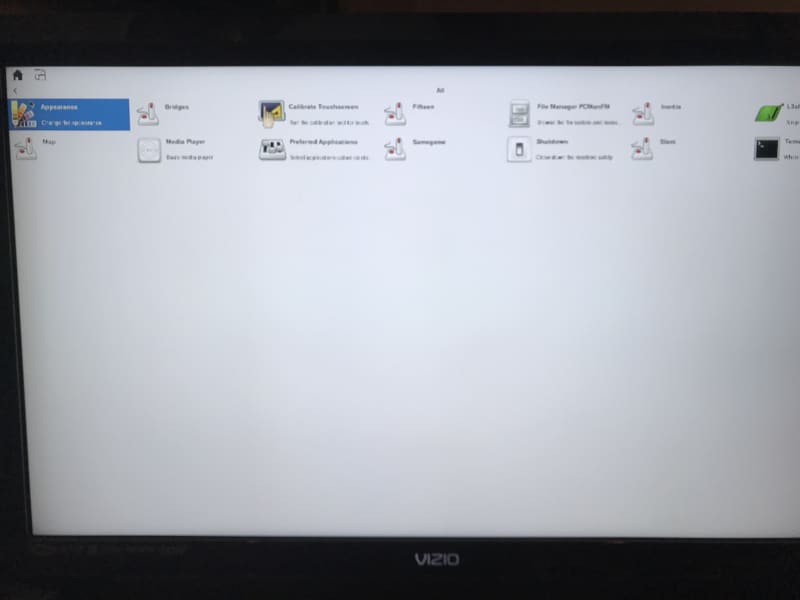
When it finished booting, I actually had a graphical interface on the screen. There are actually two screens available, with a handful of applications each:
You can toggle over to the second screen by clicking on the icon at the top right:
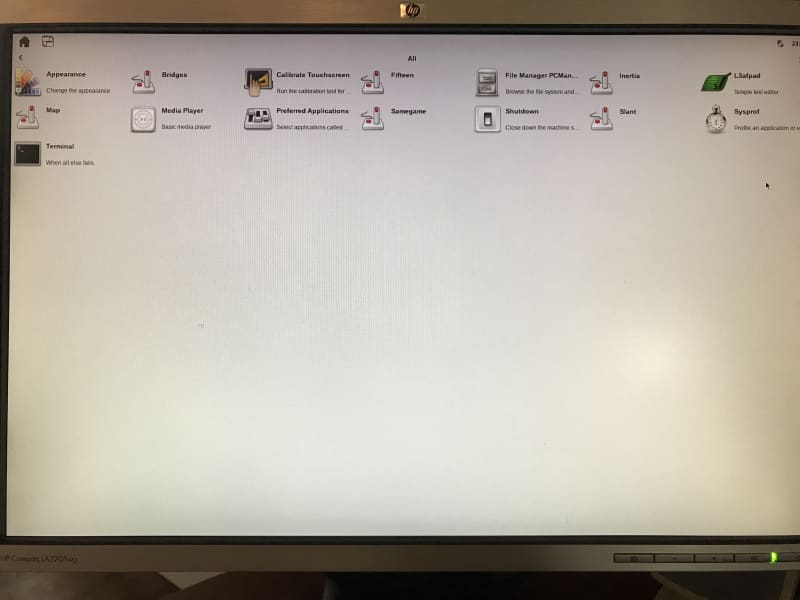
There are some primitive games, L3afpad (a simple text editor), a media player, the typical Linux terminal shell app, and others. There are also a lot more Linux commands supported within the shell, than were available in core-image-minimal. I will explore those applications later. One problem I encountered was that I was running the monitor at 1920×1080 (it’s actually an older television set) made the text difficult to read. The Sato UI seemed like it wanted a lower resolution. I scrounged up a monitor for the next step.
My next step was to build the core-image-sato-sdk. There are a number of Linux tracing and profiling tools that are available only in 'sdk' images or in images built after adding 'tools-profile' to the local.conf file. These tools, such as perf, ftrace, systemtap, Sysprof, LTTng, blktrace, look like a gold mine of debugging tools. Can any of them be used in conjunction with SourcePoint to perform some amazing debug and trace functions?
So, I followed the same steps as before, and the build worked flawlessly – well, almost flawlessly – it did crash Ubuntu once (returning me to the login screen), but I simply relaunched the build and it completed, all 7,000+ tasks.
The new bootup screen looked like this, after I found a better monitor for displaying 720p:
This build has all of the same apps as the core-image-sato, but with the added Sysprof application icon. It’s much larger (4.8GB, versus 1.1GB), because it also contains symbol information.
Double-clicking on the Sysprof icon on the target doesn’t do anything (other than having the watch icon show up for a minute, and then quietly go away).
The Yocto Project Mega-Manual has a section on Yocto Project Profiling and Tracing that shows how some of these tools work, in a “how to” or cookbook style. I decided to follow some of these directions, to see how the tools work.
The most powerful command, perf, aims to be a superset of all the tracing and profiling tools available in Linux today, including all the other tools listed above. So, that’s where I spent most of my time.
Type in ‘perf’ from the shell, and you see the following basic usage and available subcommands:
usage: perf [–version] [–help] COMMAND [ARGS]
The most commonly used perf commands are:
annotate Read perf.data (created by perf record) and display annotated code
archive Create archive with object files with build-ids found in perf.data file
bench General framework for benchmark suites
buildid-cache Manage build-id cache.
buildid-list List the buildids in a perf.data file
diff Read two perf.data files and display the differential profile
evlist List the event names in a perf.data file
inject Filter to augment the events stream with additional information
kmem Tool to trace/measure kernel memory(slab) properties
kvm Tool to trace/measure kvm guest os
list List all symbolic event types
lock Analyze lock events
probe Define new dynamic tracepoints
record Run a command and record its profile into perf.data
report Read perf.data (created by perf record) and display the profile
sched Tool to trace/measure scheduler properties (latencies)
script Read perf.data (created by perf record) and display trace output
stat Run a command and gather performance counter statistics
test Runs sanity tests.
timechart Tool to visualize total system behavior during a workload
top System profiling tool.
See 'perf help COMMAND' for more information on a specific command.
The Mega-Manual has some good examples of the usage of ‘perf stat’.
It gets more interesting when you look at the call histogram functionality. For example, running the command:
sh-4.4# perf record wget http://downloads.yoctoproject.org/mirror/sources/linux-2.6.19.2.tar.bz2
followed by
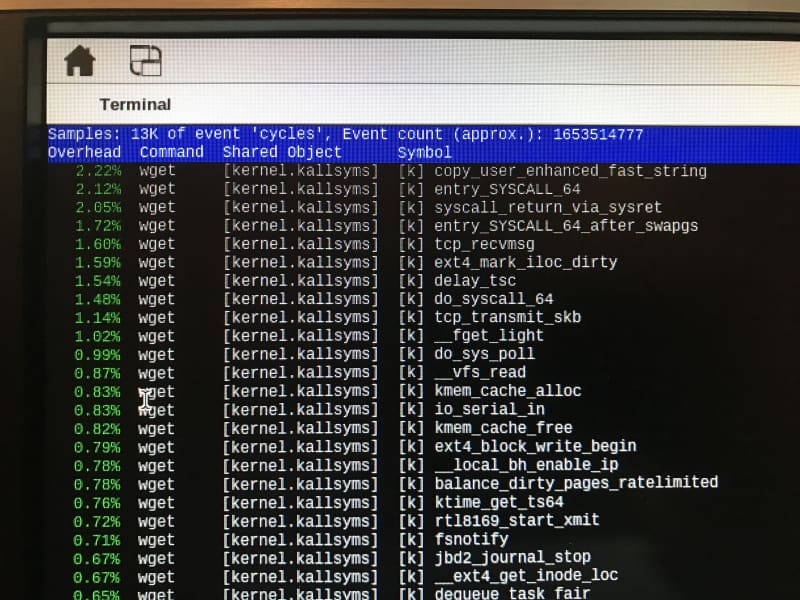
sh-4.4# perf report
reads the outputted perf.data file and displays it in a nice GUI:
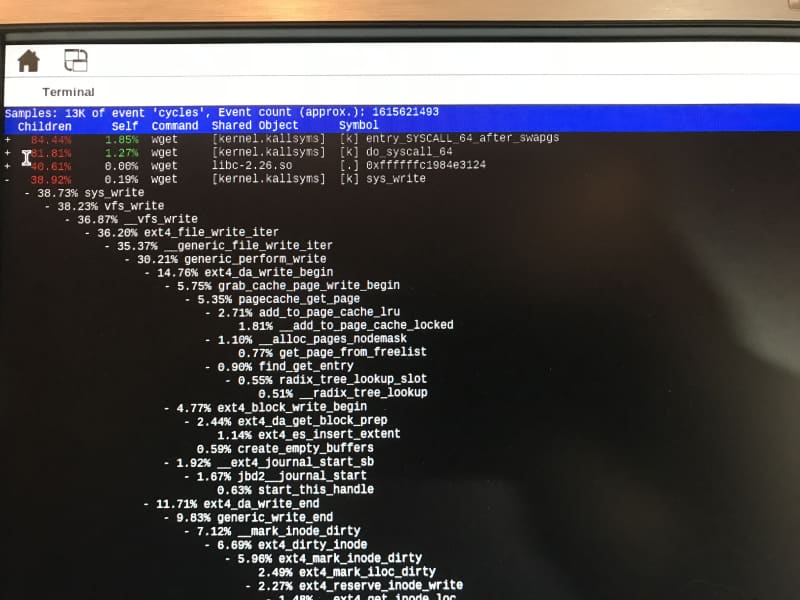
But, things get much more interesting when we display a “call tree”, similar to what SourcePoint offers. By running the command using the -g option:
perf record -g wget http://downloads.yoctoproject.org/mirror/sources/linux-2.6.19.2.tar.bz2
and then using the ‘perf report’ again, we see this, after expanding some of the function calls a little:
You can use “E” for Expand, or “C” for Collapse, all of the functions at the same time.
Needless to say, this is pretty cool. I wish it had a “call chart” capability like SourcePoint does, so I could see the time profiling of the function calls visually, but I’d guess that it is contained somewhere else within the Linux debug suites, such as perhaps oprofile or LTTng (maybe Eclipse?). Or perhaps it’s a value-add from some other purchased tools. I will be finding out!
To learn about some cool tracing tools for UEFI debug, I recommend our eBook, Guide to Intel Debug and Trace (note: requires registration).


