In Episode 30, I finally succeeded in building a Yocto Linux image for the MinnowBoard. But, it won’t boot! Is it time to drag out a copy of SourcePoint to help?
In the Chronicles Episode 30, Using all 16 Threads on my Ryzen?, I finally had some success in building a Yocto Linux image for QEMU. I can’t seem to take advantage of all 16 threads, because the build crashes consistently when the thread count is maxed out. But, in the grand scheme of things, I’ve decided not to spend too much time debugging that. The build just takes a little longer than it normally would running at full tilt: normally it completes in about 45 minutes or so. I have my eye on the prize of building a real Linux embedded image for the MinnowBoard and running it successfully.
As a warm-up and a refresher, since a lot of things have changed since I last tried this (RMA on my AMD CPU, moving from Debian to Ubuntu, new version of YP Core – Rocko 2.4.1, etc.), I wanted to first install a copy of Ubuntu Linux on the MinnowBoard. It is easy enough to just follow the instructions at the MinnowBoard.org tutorial page, Installing Ubuntu 16.04.3 LTS. This worked like a charm, just like it did way back in Episode 24, New MinnowBoard, New PC, and a nod to Netgate. It’s worth noting that a full install of Ubuntu Desktop runs very slowly on the MinnowBoard, but for me this is just a proof-of-concept and a learning experience, so that’s fine.
Feeling confident, it was time to build a fresh image for the MinnowBoard using the Yocto Project. Things have changed a bit since I last tried this, not the least of which is that we are now on the “Rocko” release of the YP. I followed the instructions in the Yocto Quick Start Guide, that describes clearly how to build an image for the MinnowBoard Turbot. And it took multiple runs before the image would build; but finally it came out.
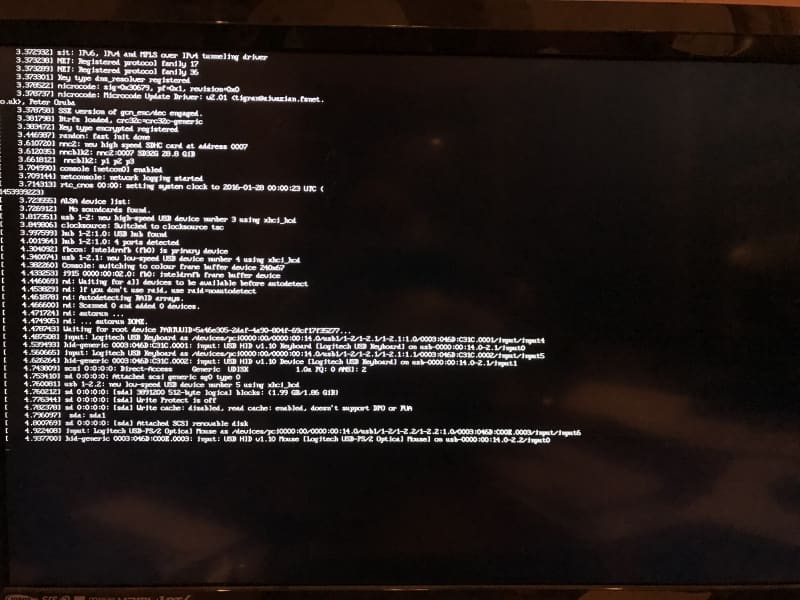
Having had success in building a Yocto Linux image, it was time to try to install it on my MinnowBoard. Just as before, this is accomplished by inserting the USB stick with the image files into the board, and then hitting F2 while powering up to go into the UEFI menu. Selecting “Boot Manager” followed by “EFI USB Device” starts the boot process:
Alas, I got the same issue as I did way back in Episode 25, Yocto builds for the MinnowBoard and the Portwell Neptune Alpha; the boot process runs up a point and then just hangs:
The boot process stalls right after it seems to be enumerating the USB keyboard and then mouse. I tried a lot of different things to get past this: get rid of the USB hub that I’m using, ditching the mouse, swapping ports, pulling the keyboard USB port out and putting it back in again, etc.
So, with all this time going by, I still haven’t managed to get my own Linux image onto the MinnowBoard. It was time to drag out the “big guns”: a tool that would help me identify root cause in the code as to why the image would not build. It was time to use our hardware-assisted debugger, SourcePoint. With its capabilities of viewing the offending code, setting breakpoints, single-stepping through the code, and finally trace capabilities, I should be able to see what’s going on.
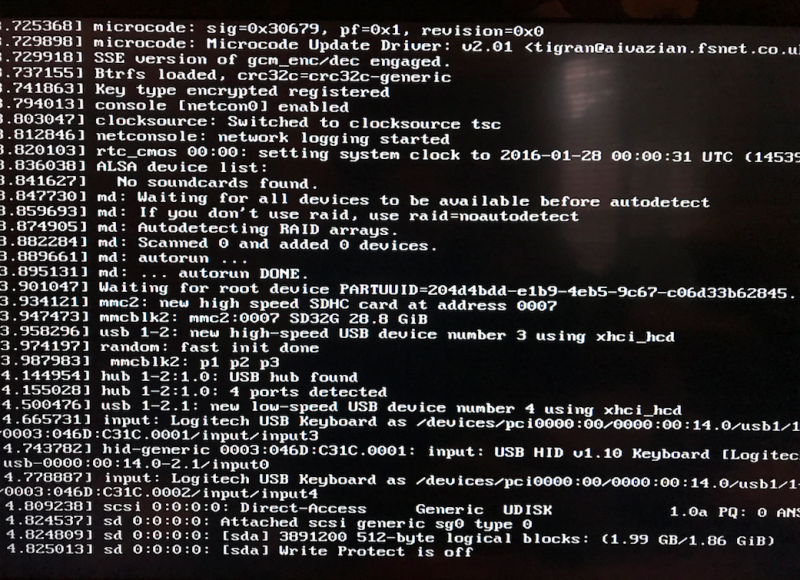
The first thing I did was to power up the MinnowBoard, and have it start booting off the USB stick. Powering up the emulator, I used JTAG to halt the boot process somewhere close to where the USB mouse enumeration is failing:
If you look carefully at the two outputs, you can see that SourcePoint halted the code flow right after the message “Write Protect is off”, which is about six lines of output above where the system hung in the prior screenshot.
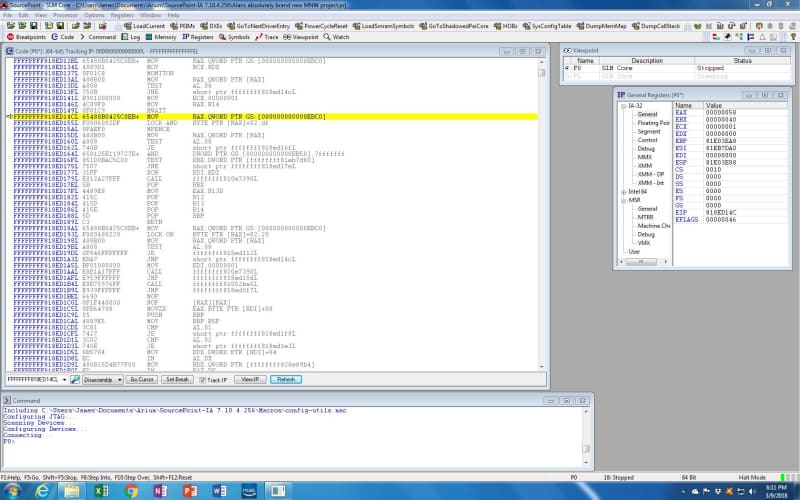
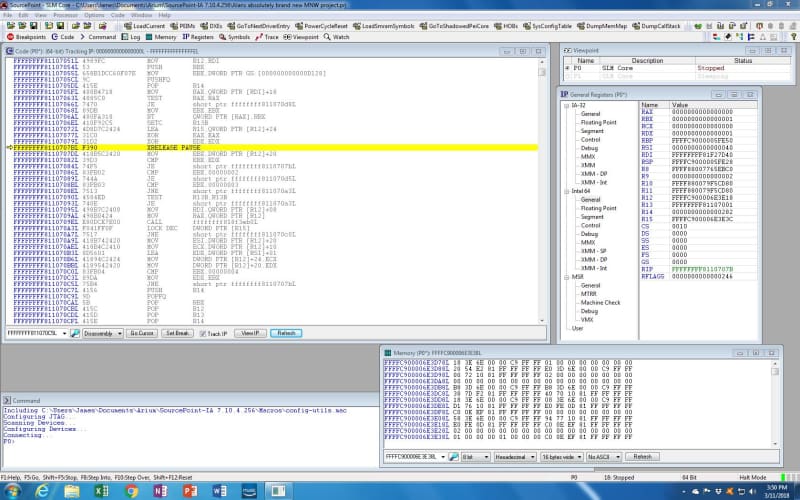
The SourcePoint screen shows that only one of the cores is running (the second core is sleeping from the Viewpoints window); the General Purpose Registers (GPRs) are displayed; and the Code window shows where we are in the boot code:
The information in the Code window isn’t particularly edifying to me. I do see a couple of instructions I haven’t tripped across before in my UEFI travels, such as “LOCK AND” and “MFENCE”; but without source code, it’s hard to see what’s going on.
Just for reference’s sake, here is what the Intel Software Developer’s Manual, Volume 2B says:
LOCK
Causes the processor’s LOCK# signal to be asserted during execution of the accompanying instruction (turns the instruction into an atomic instruction). In a multiprocessor environment, the LOCK# signal ensures that the processor has exclusive use of any shared memory while the signal is asserted.
In most IA-32 and all Intel 64 processors, locking may occur without the LOCK# signal being asserted. See the “IA- 32 Architecture Compatibility” section below for more details.
MFENCE
Performs a serializing operation on all load-from-memory and store-to-memory instructions that were issued prior the MFENCE instruction. This serializing operation guarantees that every load and store instruction that precedes the MFENCE instruction in program order becomes globally visible before any load or store instruction that follows the MFENCE instruction. The MFENCE instruction is ordered with respect to all load and store instructions, other
MFENCE instructions, any LFENCE and SFENCE instructions, and any serializing instructions (such as the CPUID instruction). MFENCE does not serialize the instruction stream.
Weakly ordered memory types can be used to achieve higher processor performance through such techniques as out-of-order issue, speculative reads, write-combining, and write-collapsing. The degree to which a consumer of data recognizes or knows that the data is weakly ordered varies among applications and may be unknown to the producer of this data. The MFENCE instruction provides a performance-efficient way of ensuring load and store ordering between routines that produce weakly-ordered results and routines that consume that data.
Processors are free to fetch and cache data speculatively from regions of system memory that use the WB, WC, and WT memory types. This speculative fetching can occur at any time and is not tied to instruction execution. Thus, it is not ordered with respect to executions of the MFENCE instruction; data can be brought into the caches speculatively just before, during, or after the execution of an MFENCE instruction.
Rather than continue any investigations into the use of these instructions at this time, I decided to then let the boot process continue until it hangs, by using the Run button; and then halt it again, and see what I could learn.
Interestingly, nothing further comes out on the screen over the HDMI connection. I realize that I should have had the serial output capture on my Mac’s CoolTerm application as a backup, but that’s for later.
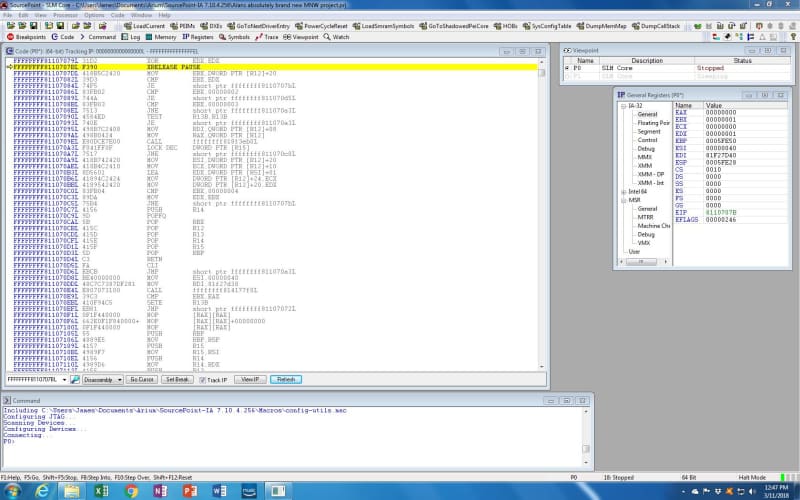
But we’re at a different point in the code now:
Again, we are halted at an instruction “XRELEASE PAUSE” that I am not familiar with. The SDM reveals XACQUIRE and XRELEASE as “prefix hints”:
The XRELEASE prefix hint can only be used with the following instructions (also referred to as XRELEASE-enabled when used with the XRELEASE prefix):
- Instructions with an explicit LOCK prefix (F0H) prepended to forms of the instruction where the destination operand is a memory operand: ADD, ADC, AND, BTC, BTR, BTS, CMPXCHG, CMPXCHG8B, DEC, INC, NEG, NOT, OR, SBB, SUB, XOR, XADD, and XCHG.
- The XCHG instruction either with or without the presence of the LOCK prefix.
- The “MOV mem, reg” (Opcode 88H/89H) and “MOV mem, imm” (Opcode C6H/C7H) instructions. In these cases, the XRELEASE is recognized without the presence of the LOCK prefix.
The lock variables must satisfy the guidelines described in Intel® 64 and IA-32 Architectures Software Developer’s Manual, Volume 1, Section 16.3.3, for elision to be successful, otherwise an HLE abort may be signaled.
This is a little obscure. I don’t see reference to an “XRELEASE PAUSE” anywhere in the SDM, or just about anywhere in Google. But looking at the definition of the PAUSE instruction might be educational:
Improves the performance of spin-wait loops. When executing a “spin-wait loop,” processors will suffer a severe performance penalty when exiting the loop because it detects a possible memory order violation. The PAUSE instruction provides a hint to the processor that the code sequence is a spin-wait loop. The processor uses this hint to avoid the memory order violation in most situations, which greatly improves processor performance. For this reason, it is recommended that a PAUSE instruction be placed in all spin-wait loops.
An additional function of the PAUSE instruction is to reduce the power consumed by a processor while executing a spin loop. A processor can execute a spin-wait loop extremely quickly, causing the processor to consume a lot of power while it waits for the resource it is spinning on to become available. Inserting a pause instruction in a spinwait loop greatly reduces the processor’s power consumption.
This instruction was introduced in the Pentium 4 processors, but is backward compatible with all IA-32 processors. In earlier IA-32 processors, the PAUSE instruction operates like a NOP instruction. The Pentium 4 and Intel Xeon processors implement the PAUSE instruction as a delay. The delay is finite and can be zero for some processors. This instruction does not change the architectural state of the processor (that is, it performs essentially a delaying no-op operation).
Presuming that the disassembled code is correct, I can only guess that we are in some sort of critical time loop, maybe a CPU deadloop. Will it ever exit? There’s only one way to find out: keep stepping through the code and use SourcePoint to provide some insight into the loop.
There are four instructions that are part of the loop:
FFFFFFFF8110707BL F390 XRELEASE PAUSE
FFFFFFFF8110707DL 418B5C2420 MOV EBX, DWORD PTR [R12]+20
FFFFFFFF81107082L 39D3 CMP EBX, EDX
FFFFFFFF81107084L 74F5 JE SHORT PTR FFFFFFFF8110707B
You can see from the screenshot that both EBX and EDX are set to 1 currently, so the loop will keep executing until EBX gets changed by the MOV instruction, that sets EBX to the value contained at the address 20 bytes offset from the contents of R12. We need to see the Intel 64 GPRs in order to determine what address is contained within R12, and then to peek at the address offset 20 bytes from that:
R12 contains FFFFC900006E3E18, and the x’20’ offset yields FFFFC900006E3E38, and looking at the memory display windows shows that address containing 0000000100000001 (remember that x86 is little-endian). Taking the DWORD value always yields 1 being put into EBX. This is a deadloop; unless some other process changes the value at address FFFFC900006E3E38, it will never exit the loop. And that is just what I found.
I did try to tinker with the contents of the EDX register, and also the value at FFFFC900006E3E38, and did manage to get the code to temporarily exit the four-instruction loop. But, it always came back to the deadloop, sooner or later.
There are quite a few different directions I could go at this point, including using some of the x86 Trace features like Branch Trace & Store (BTS) to follow the code flow leading up to this problem. But, realistically, admitting that, one way or the other, I’m lost without source code, that’s become the next step: creating my Yocto Linux build with source and symbols, and loading them into SourcePoint so I can see exactly what is happening in this area of the code. There are no guarantees that seeing the source will help me debug this problem, but it’s a start.
This looks like a big challenge. Even though I’ve read Robert Love’s Linux Kernel Development from cover to cover, I am by no means a Linux expert (which should be obvious to anyone following these MinnowBoard Chronicles episodes), let alone understanding the operations of the kernel well enough to figure out why it won’t boot. There is an entire document at Yocto Project Linux Kernel Development Manual that should help me, though. We’ll see how it goes!
With source code, I should be able to see what code is accessing FFFFC900006E3E18, and set a Data Write breakpoint at that point to see what is putting data in there. I’ll also be able to use SourcePoint’s support for the powerful x86 Trace features (check out the eBook; requires registration) to see backwards in time and maybe get some insight as to why I’m stuck in the deadloop. Should be fun!


