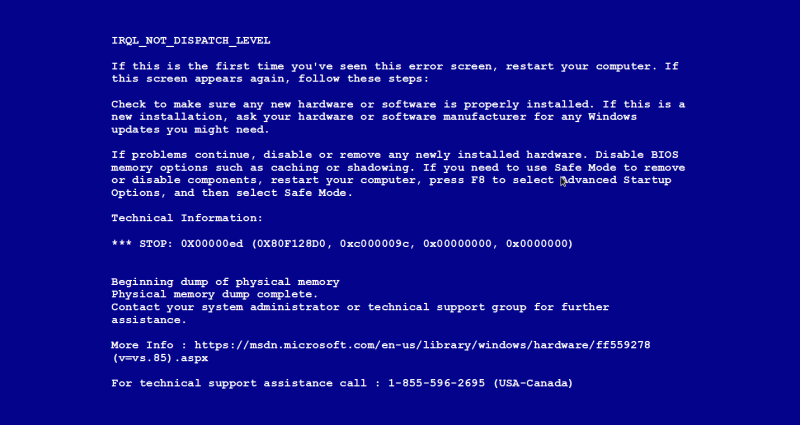
One in 10,000 times, your notebook crashes when you wake it up in the middle of a backup of your hard disk. No big deal?
Let’s face it, no one likes the Blue Screen of Death (BSOD). It often happens at the worst times: when you’re working on a critical document, late for a meeting, or doing an important presentation to a customer.
The frequency of the BSOD is directly related to the amount of code in any system, the complexity of the silicon and hardware design, and the amount of testing that goes into a given platform design. It is impossible to test all conceivable configurations and use cases for a consumer product like a notebook. And all systems, notebooks or otherwise, are shipped with known faults. Given that there are roughly 150 million notebooks shipped every year, OEMs must make tradeoffs between cost and quality. Everyone knows that their notebook will throw a BSOD once in a while; if it happens once per year, that’s probably acceptable; if it happens every day, you’re looking for a replacement.
Windows will throw a BSOD when the system cannot recover from a fault. These unrecoverable faults can stem from hardware, firmware, or software. The intent is to reset the system and put it back into a known, deterministic state. Otherwise, system corruption might create inconsistent data: for example, dropping a decimal point on your bank account balance.
If the root origin of the BSOD is hardware, it is fairly straightforward to isolate the faulty part and replace it. If the origin is software, a utility like WinDbg provides an enormous amount of detail on the system state at the time of the crash, including a stack trace (presuming the crash dump is accessible). If the origin is firmware, or some sort of combination of firmware + software + hardware, things get a little more difficult.
Let’s take an example. Complex bugs that might ultimately cause a BSOD often originate when multiple agents are executing simultaneously on a platform. On Intel platforms, these might include the BIOS/ACPI code, drivers, the Intel Management Engine, and other sources. Each of these present the possibility of trampling on each other; for example, a programming error in one agent causes a variable to be corrupted, which in turn causes a linked list in another agent to malfunction. A common error in a sensor interrupt service routine might look like:
sensor.sensor_buf[buf_index] = GetSensorData();
if (++buf_index > MAX_SENSOR)
buf_index = 0;
INTERRUPT_IODeviceNotifyTask(&sensordev);
The code is actually dereferencing beyond the range of the array before doing its check (note the “>” should actually be “>=”). This in turn could cause a linked list corruption within the ACPI code. The manifestation might be a BSOD.
Diagnosing such bugs is extremely difficult. Amazingly so, many engineers still use printf statements and port 80 POST codes to troubleshoot such problems. This can take weeks or months’ worth of futile effort; it’s like trying to dig a swimming pool with a teaspoon. Luckily, Intel silicon now contains Intel Processor Trace and Trace Hub capabilities, and when combined with Intel run-control JTAG-based debugging, is like having printf on steroids, all in a meaningful code context.
Trace is like having a DVR, versus watching live network television. It’s extremely easy to track down, for example, the code context of Event Tracing for Windows (ETW) messages directed through the Trace Hub. For example, an exotic bug, manifested intermittently when a notebook is awakening out of an S4 sleep state and processing packets, as in our example above, would show up quickly using these trace technologies.
Want to learn more about Trace capabilities on Intel platforms, and become an expert? See our eBook New Methods for Software Debug (note: requires registration).


