
It is possible to break at the earliest part of Windows boot via the ENABLEJTAGBREAK facility made available within bootmgfw!BlBdWaitForJtagHwDebugger. In this article, there’s a short description and video whereby I’ve collected Intel Processor Trace as the target boots from early Windows to the first SMM entry; and then used AI to analyze it. The results are outstanding.
Good background reading on the use of ENABLEJTAGBREAK is in the following three articles:
JTAG debug of Windows Hyper-V / Secure Kernel with WinDbg and EXDI: Part 8
JTAG debug of Windows Hyper-V / Secure Kernel with WinDbg and EXDI: Part 9
Debugging Windows Defender Application Control (WDAC) Policies
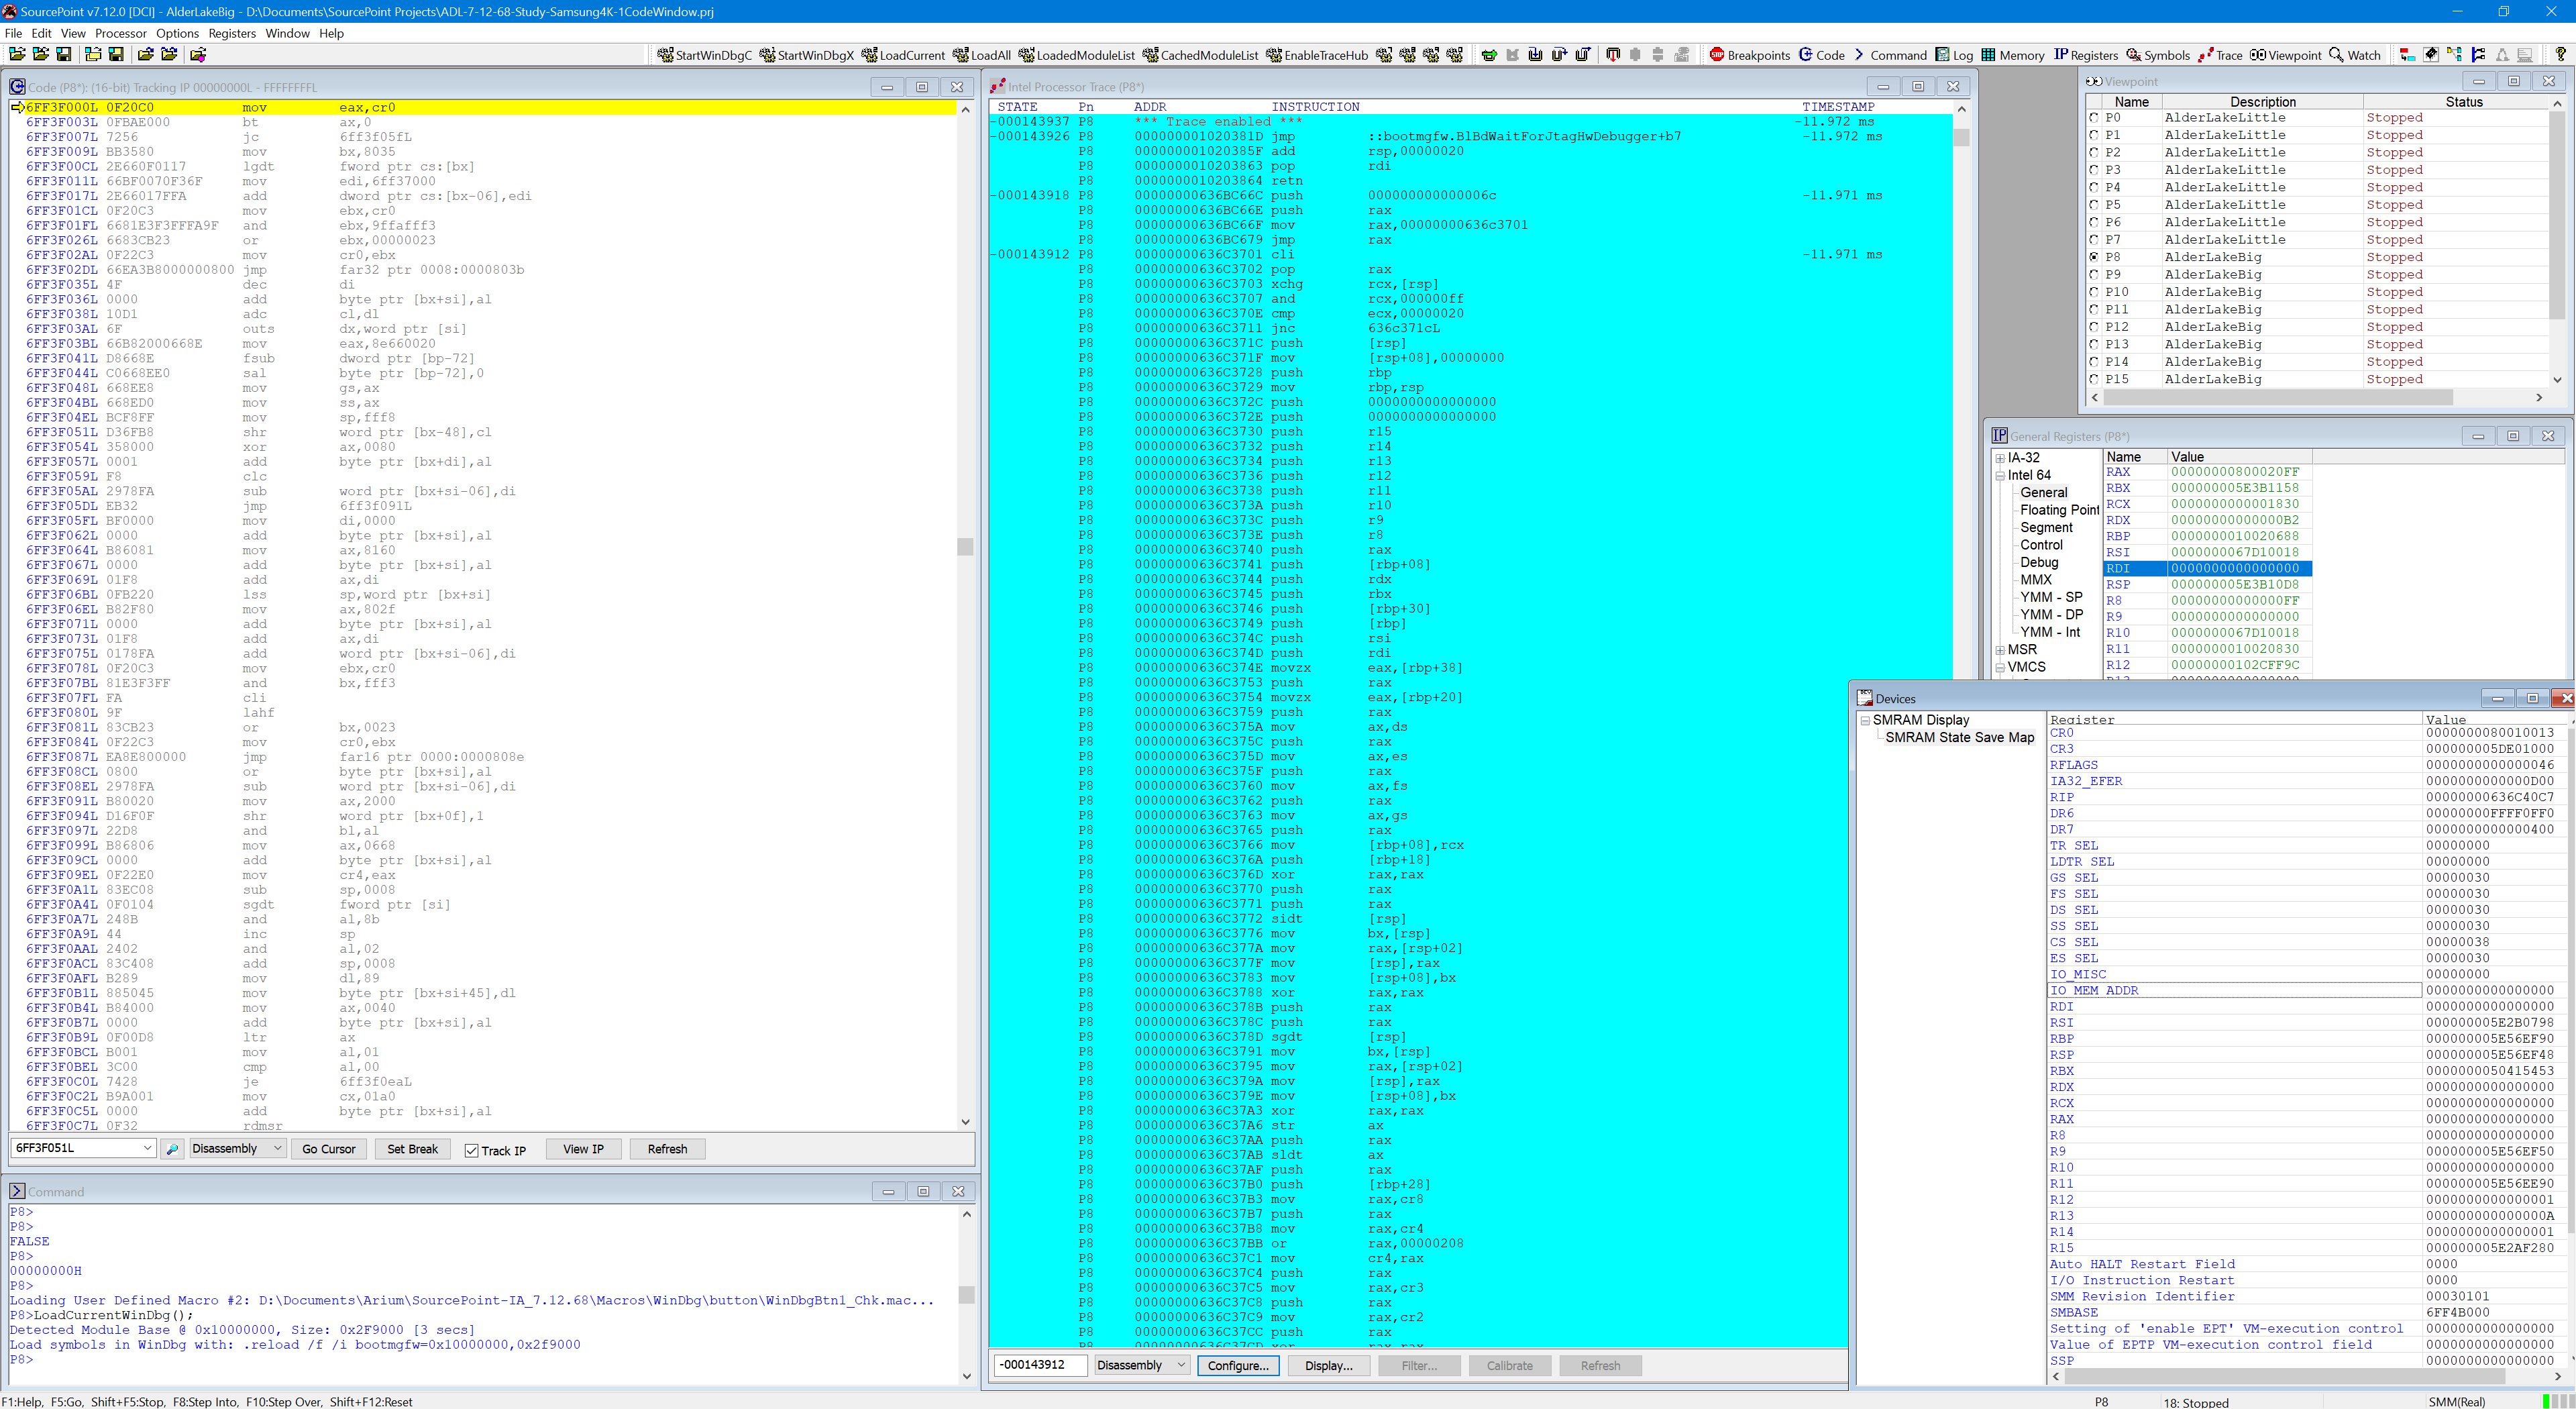
If a picture is worth a thousand words, a video is worth many more. In this blog, I’ve recorded a short (two and a half minute) video wherein:
- The ENABLEJTAGBREAK parameter is taken by bootmgfw.efi, that puts the Windows target into a spinloop.
- SourcePoint uses JTAG to halt the target and get out of the spinloop.
- An SMM Entry breakpoint is set.
- Intel Processor Trace is enabled.
- The target is put back into a Running state, and the first SMI breakpoint is hit.
- Intel Processor Trace is captured for all the code executed.
- The Intel PT is fed into ChatGPT o3, which reasons out the code flow and displays the analysis.
The video really says it all. The use of dynamic analysis via Intel PT complements the static analysis obtainable via tools like Hex-Rays’ IDA. The problem with static analysis is that you really don’t know what path the code will take. And having a huge amount of trace data, much larger than any human can comprehend, analyzed by an LLM with reasoning yields insights in minutes that would take traditional analysis weeks or months to do.
In some ways, this is the dawn of a new era. And the AI model will improve as the context windows improves. No matter what your skill level is: BIOS developer, driver writer, security researcher: this technique makes code more approachable and accessible, and offloads a huge amount of tedious work. Take some of your top engineers and equip them with dynamic analysis provided by AI reasoning will save months spent on bug and threat analysis.
Offhand, I can’t think of a better way to understand and debug current code.
Here’s the 2.5-minute video:
I’ll cover this topic, and more, in my upcoming webinar, , to be held on Tuesday, July 15th at 10am USA Central Time. The registration link is here: Advanced Threat Analysis and Reverse Engineering using AI, IDA Pro, and the SourcePoint JTAG Debugger. Even if you can’t attend, register to receive a link to the recording afterwards.